. 2017 Mar 15;7(1):196.
doi: 10.1038/s41598-017-00139-2.

The purinergic receptor P2X5 regulates inflammasome activity and hyper-multinucleation of murine osteoclasts

Affiliations

The purinergic receptor P2X5 regulates inflammasome activity and hyper-multinucleation of murine osteoclasts

Hyunsoo Kim et al. Sci Rep. .

Abstract

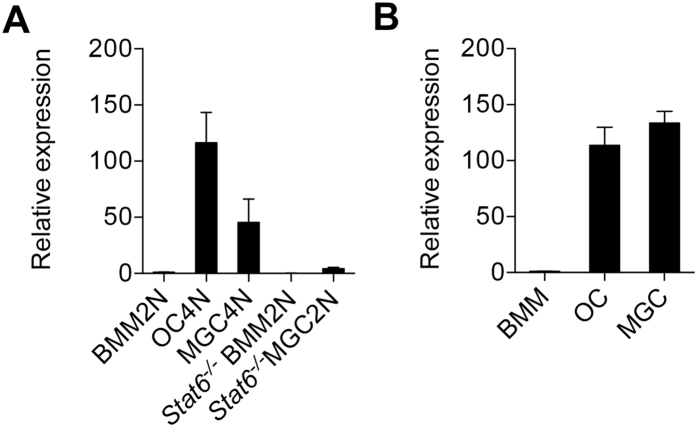
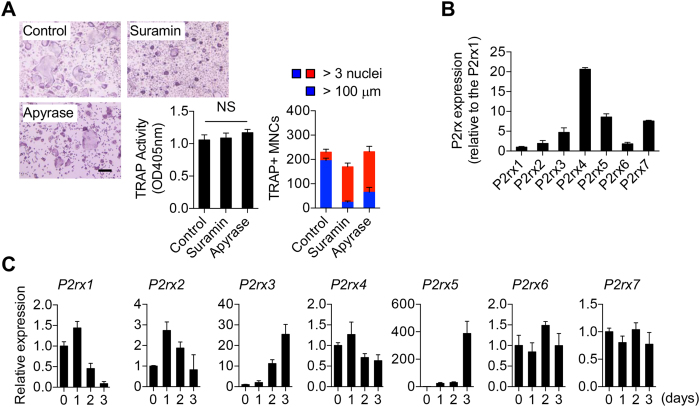
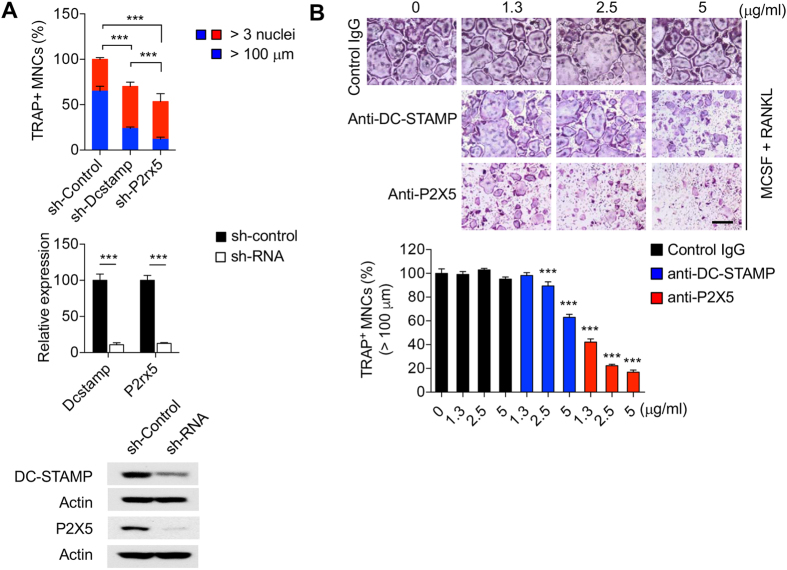
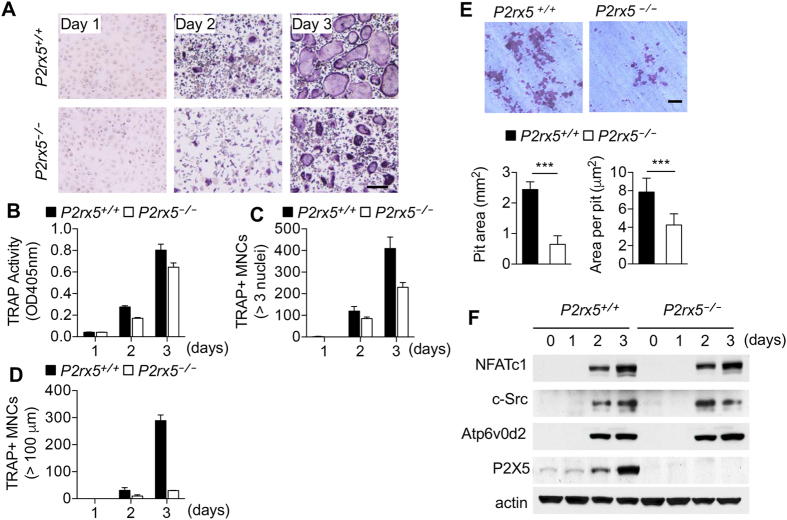
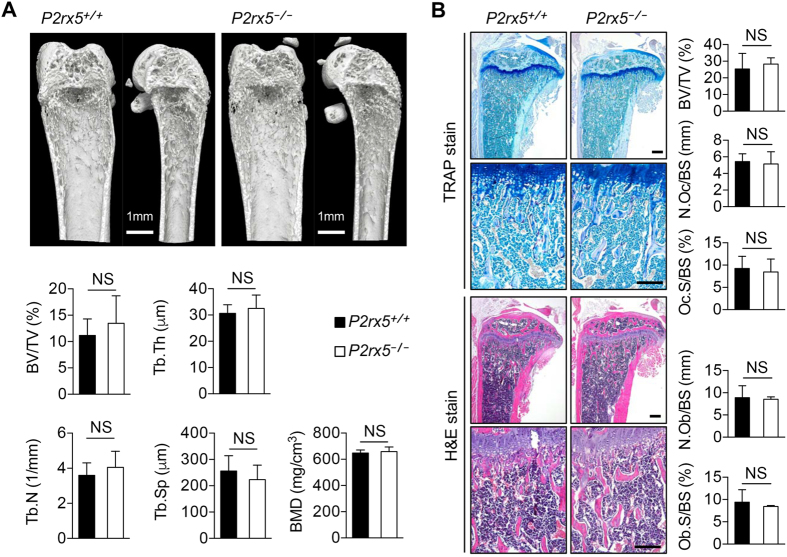
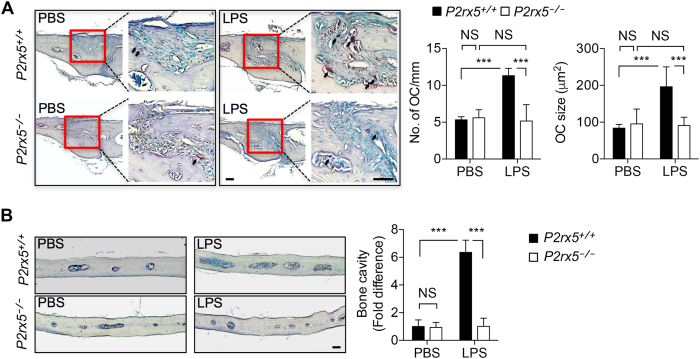
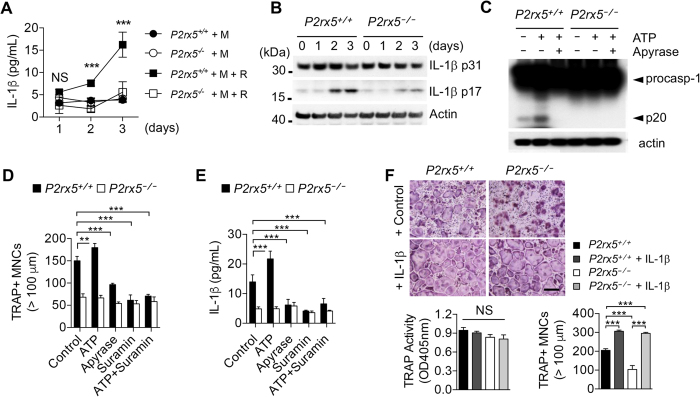
Excessive bone resorption by osteoclasts (OCs) can result in serious clinical outcomes, including bone loss that may weaken skeletal or periodontal strength. Proper bone homeostasis and skeletal strength are maintained by balancing OC function with the bone-forming function of osteoblasts. Unfortunately, current treatments that broadly inhibit OC differentiation or function may also interfere with coupled bone formation. We therefore identified a factor, the purinergic receptor P2X5 that is highly expressed during the OC maturation phase, and which we show here plays no apparent role in early bone development and homeostasis, but which is required for osteoclast-mediated inflammatory bone loss and hyper-multinucleation of OCs. We further demonstrate that P2X5 is required for ATP-mediated inflammasome activation and IL-1β production by OCs, and that P2X5-deficient OC maturation is rescued in vitro by addition of exogenous IL-1β. These findings identify a mechanism by which OCs react to inflammatory stimuli, and may identify purinergic signaling as a therapeutic target for bone loss-related inflammatory conditions.


Conflict of interest statement

The authors declare that they have no competing interests.

Figures

Figure 1
Figure 1
Expression of P2rx5 is associated with cellular multinucleation. (A) Expression of P2rx5 in pre-commitment mono-nuclear cells and multinucleation-committed bi-nucleated cells. Relative expression of P2rx5 compared to bi-nuclear BMMs (BMM2N). Multinucleation-committed bi-nucleated cells were sorted from RANKL + M-CSF-induced OCs or from IL-3 + IL-4-induced MGCs, and pre-commitment mono-nuclear cells were sorted from M-CSF-cultured BMMs, or from IL-3 + IL-4-induced STAT6 −/− MGCs. Total RNAs were isolated, and all transcripts were sequenced by RNA sequencing. Results of the expression of P2rx5 are shown as mean ± SD of three independent experiments. (B) qPCR validation of P2rx5 expression in BMMs, OCs and MGCs. Relative expression of P2rx5 compared to BMMs is shown. Data were normalized to 18s rRNA and are shown as mean ± SD.
Figure 2
Figure 2
Function and expression of purinergic receptors during osteoclast maturation. (A) Effect of the purinergic receptor antagonist suramin on OC differentiation. BMMs were cultured for 3 days +/− suramin (20 μM) in the presence of M-CSF (30 ng/ml) and RANKL (150 ng/ml). Cells were then stained for TRAP and observed by microscopic examination. OCs with more than 3 nuclei and 100 μm in size were counted. Scale bar, 100 μm. NS, not significant. **P < 0.01, ***P < 0.001. Data are shown as means ± SD. (B) Comparative expression of P2rx subfamily members in mature OCs as determined by qPCR analysis of mRNA. (C) Relative induction of P2rx subfamily members during OC differentiation/maturation culture as determined by qPCR analysis of mRNA. Data are shown as means ± SD.
Figure 3
Figure 3
Inhibition of P2X5 suppresses in vitro OC maturation. (A) TRAP+ MNCs in mature (3 days post-addition of RANKL) OC cultures retrovirally-transduced with control shRNA, or shRNAs against Dcstamp or P2rx5, upper panel. Relative (to control shRNA-tranduced cells) expression of Dcstamp or P2rx5 in mature OC cultures retrovirally-transduced with control shRNA, or shRNAs against Dcstamp or P2rx5, as determined by qPCR, middle panel. Western blot analysis of expression of DC-STAMP or P2X5 in mature OC cultures retrovirally-transduced with control shRNA, or shRNAs against Dcstamp or P2rx5, lower panel. (B) OC cultures treated with increasing concentrations of control IgG, inhibitory anti-DC-STAMP, or inhibitory anti-P2X5 polyclonal antibodies. The upper panel shows the effects on day 3 OC cultures and the lower panel shows quantitation of decreases in TRAP+ MNCs relative to control IgG treatment. Scale bar represents 100 μm. ***P < 0.001. Data are shown as means ± SD.
Figure 4
Figure 4
P2rx5 deficiency suppresses in vitro OC maturation. (A–D) P2rx5 +/+ and P2rx5 −/− BMMs were cultured for the indicated times in the presence of M-CSF and RANKL. (A) Bright-field images of OCs stained for TRAP and (B) quantitation of TRAP activity in OCs measured at OD405nm. TRAP+ MNCs were enumerated both by (C) the presence of more than 3 nuclei and (D) cell size larger than 100 μm in diameter. Scale bar represents 100 μm. (E) Bone resorption activity of P2rx5 +/+ and P2rx5 −/− during OC differentiation. BMMs were cultured on dentine slices for 3 days with M-CSF and RANKL to induce OC differentiation, then OCs were further incubated for 2 additional days, and pit areas analyzed. Resorption area (left plot) and resorption area per OC (right plot). Scale bar represents 200 μm. ***P < 0.001. Data are shown as means ± SD. (F) Western blot analysis of NFATc1, c-Src, Atp6v0d2 and P2X5 expression during osteoclast differentiation. Lysates were made at indicated time points from P2rx5 +/+ and P2rx5 −/− OC cultures. Probing against actin was performed for normalization.
Figure 5
Figure 5
Normal bone development and homeostasis in P2rx5 −/− mice. (A) Representative 3D reconstructions of trabecular bone. The tibias of 8-week-old male P2rx5 +/+ and P2rx5 −/− littermate mice were analyzed by μCT scanning. Calculations of bone volume per tissue volume (BV/TV), trabecular thickness (Tb.Th), trabecular number (Tb.N), trabecular space (Tb.Sp) and bone mineral density (BMD) are shown. Scale bar, 1mm. NS, not significant. Data are means ± SD. (B) Histomorphometric analyses, representative TRAP staining (upper panel) and H&E staining (lower panel). Also shown are BV/TV, osteoclast number per bone surface (N.Oc/BS), OC surface per bone surface (Oc.S/BS), osteoblast number per bone surface (N.Ob/BS) and osteoblast surface per bone surface (Ob.S/BS). Scale bar represents 100 μm. NS, not significant. Data are means ± SD.
Figure 6
Figure 6
Decreased inflammatory bone loss in P2rx5 −/− mice. (A) TRAP staining of histological sections of the sagittal suture, with arrows indicating TRAP+ OCs (left panel), and quantitation of the number and mean size (shown as mean OC area) of OCs (right panel). ***P < 0.001. Data are means ± SD. (B) Resorption cavities in the parietal calvarium tissue area were measured for PBS- and LPS-treated P2rx5 +/+ and P2rx5 −/− mice, and then normalized to the measurement for PBS-treated P2rx5 +/+ samples to determine fold differences. Scale bar represents 100 μm. ***P < 0.001. Data are means ± SD.
Figure 7
Figure 7
P2X5-mediated inflammasome activation and IL-1β production enhance OC maturation. (A) Production of IL-1β during OC differentiation. Levels of IL-1β in culture supernatants were determined by ELISA. ***P < 0.001. NS, not significant. Data are means ± SD. (B) Pro-IL-1β and mature-IL-1β production during OC differentiation. BMMs were cultured for the indicated time with M-CSF and RANKL. Western blot analysis was performed to assess the expression of Pro-IL-1β and mature-IL-1β during OC differentiation. At days 0, 1, 2 and 3, whole cell extracts were subjected to western blot analysis with the indicated antibodies. The results are representative of at least two independent sets of similar experiments. (C) Activation of caspase-1 at day 3. BMMs were cultured for 3 days in the presence of M-CSF and RANKL. Cultured cells treated with apyrase (10 units/ml) 1 hr before +/− addition of extracellular ATP (100 μM) for 1 hr then subjected to western blot analysis with the anti-caspase-1 (p20) and anti-actin. (D and E) BMMs were cultured for 2 days in the presence of M-CSF and RANKL, then cultured for 1 day in the presence of ATP, apyrase and/or suramin (20 μM). **P < 0.01, ***P < 0.001. NS, not significant. Data are shown as means ± SD. (D) Enumeration of >100 μm TRAP+ MNCs per culture well. (E) Levels of IL-1β in culture supernatants were determined by ELISA. ***P < 0.001. Data are means ± SD. (F) BMMs were cultured for 2 days in the presence of M-CSF and RANKL, then cultured for 1 day with or without IL-1β. Cells were fixed and stained for TRAP activity (lower left panel), and TRAP+ MNCs were enumerated (lower right panel). Scale bar represents 100 μm.

Similar articles

Cited by

References

    1. Moutsopoulos NM, et al. Defective neutrophil recruitment in leukocyte adhesion deficiency type I disease causes local IL-17-driven inflammatory bone loss. Science translational medicine. 2014;6:229ra240. doi: 10.1126/scitranslmed.3007696. - DOI - PMC - PubMed
    1. Souza PP, Lerner UH. The role of cytokines in inflammatory bone loss. Immunological investigations. 2013;42:555–622. doi: 10.3109/08820139.2013.822766. - DOI - PubMed
    1. Binder NB, et al. Estrogen-dependent and C-C chemokine receptor-2-dependent pathways determine osteoclast behavior in osteoporosis. Nature medicine. 2009;15:417–424. doi: 10.1038/nm.1945. - DOI - PubMed
    1. Ehrlich LA, Roodman GD. The role of immune cells and inflammatory cytokines in Paget’s disease and multiple myeloma. Immunological reviews. 2005;208:252–266. doi: 10.1111/j.0105-2896.2005.00323.x. - DOI - PubMed
    1. Miyazaki T, Tokimura F, Tanaka S. A review of denosumab for the treatment of osteoporosis. Patient preference and adherence. 2014;8:463–471. doi: 10.2147/PPA.S46192. - DOI - PMC - PubMed

Publication types