. 2017 Mar 15;7(1):199.
doi: 10.1038/s41598-017-00241-5.

Combined transplantation of human mesenchymal stem cells and human retinal progenitor cells into the subretinal space of RCS rats

Affiliations

Combined transplantation of human mesenchymal stem cells and human retinal progenitor cells into the subretinal space of RCS rats

Linghui Qu et al. Sci Rep. .

Abstract

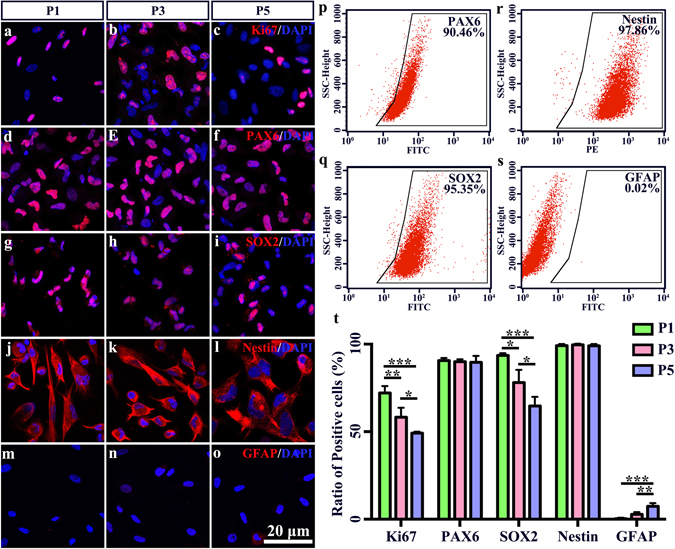
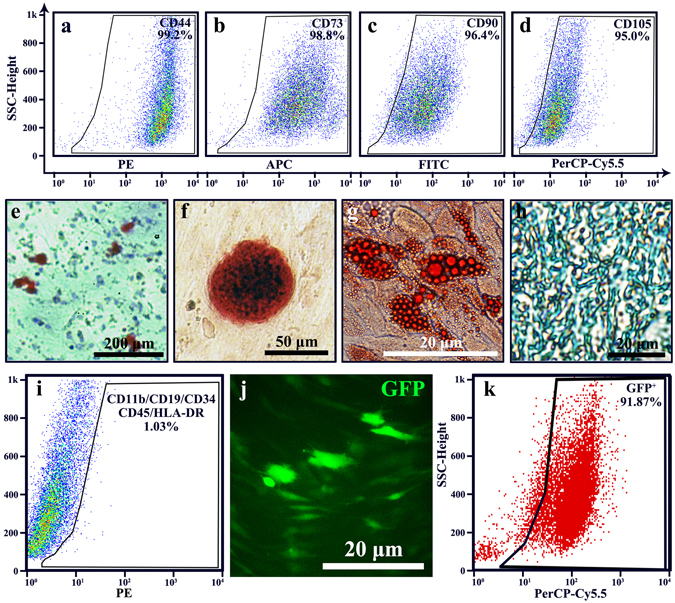
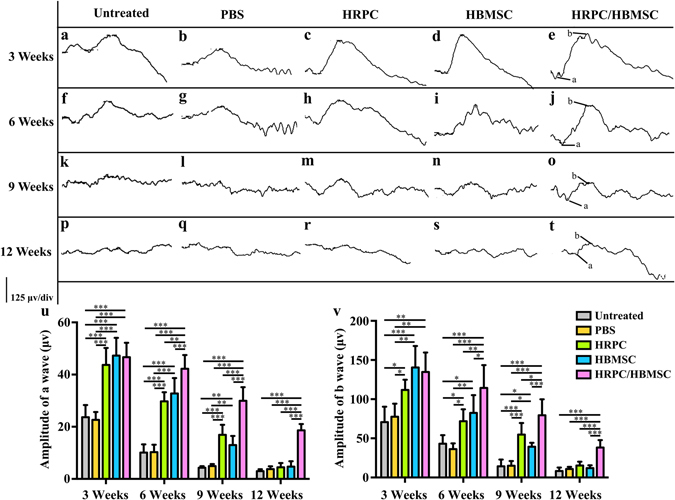
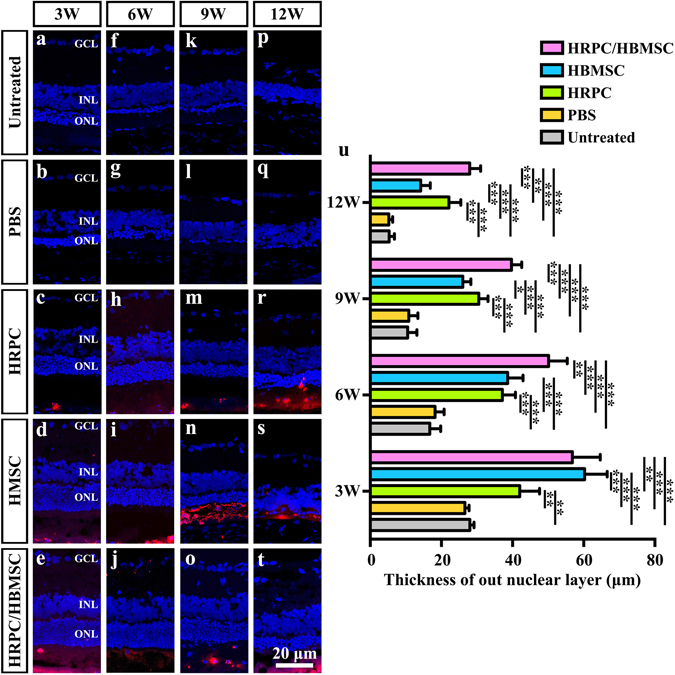
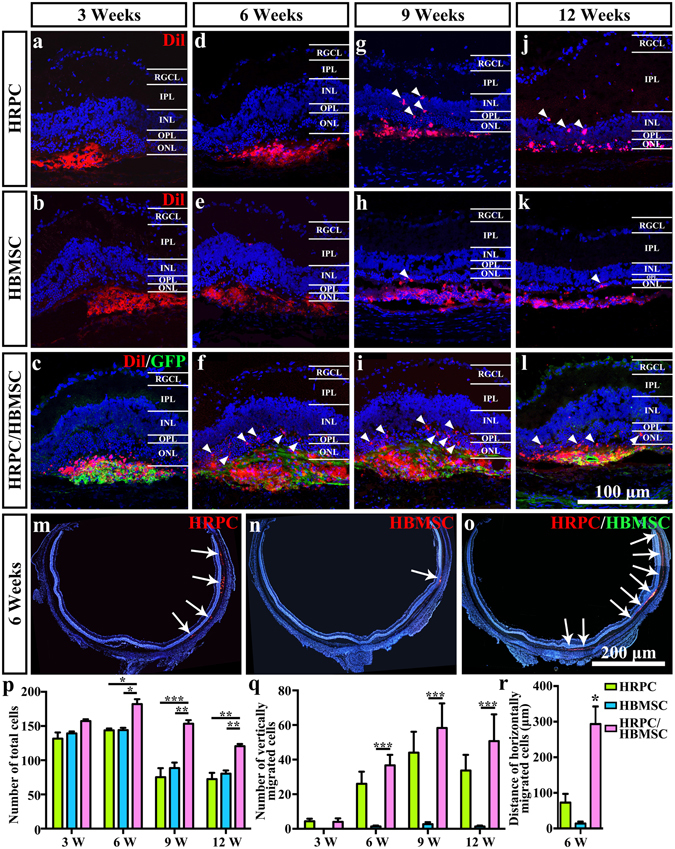
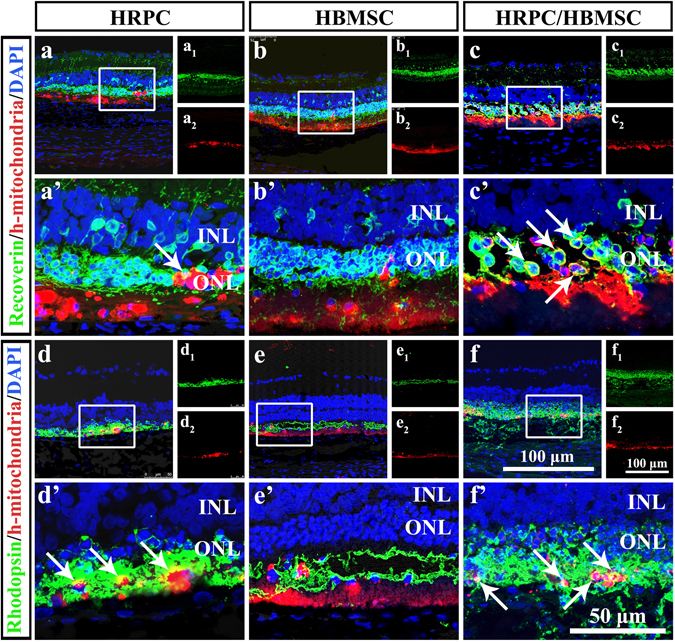
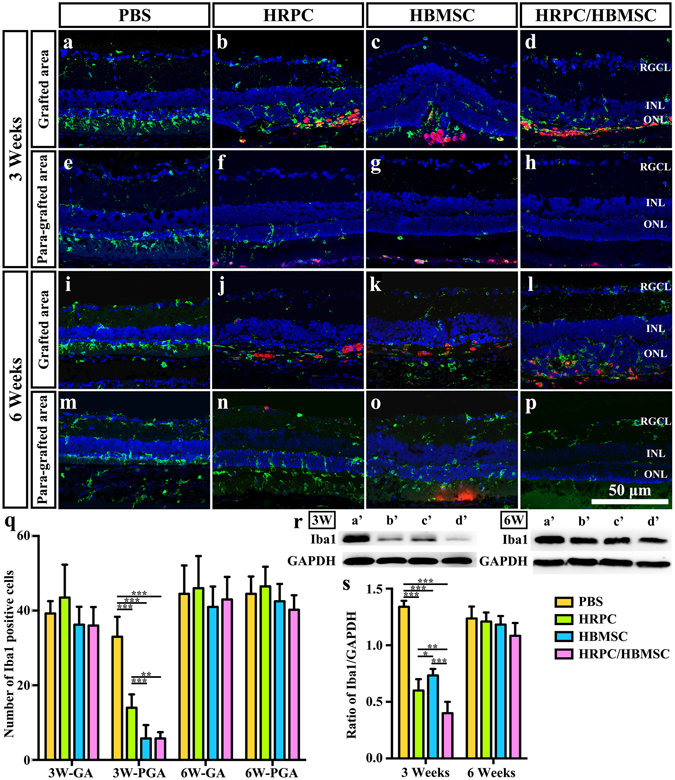
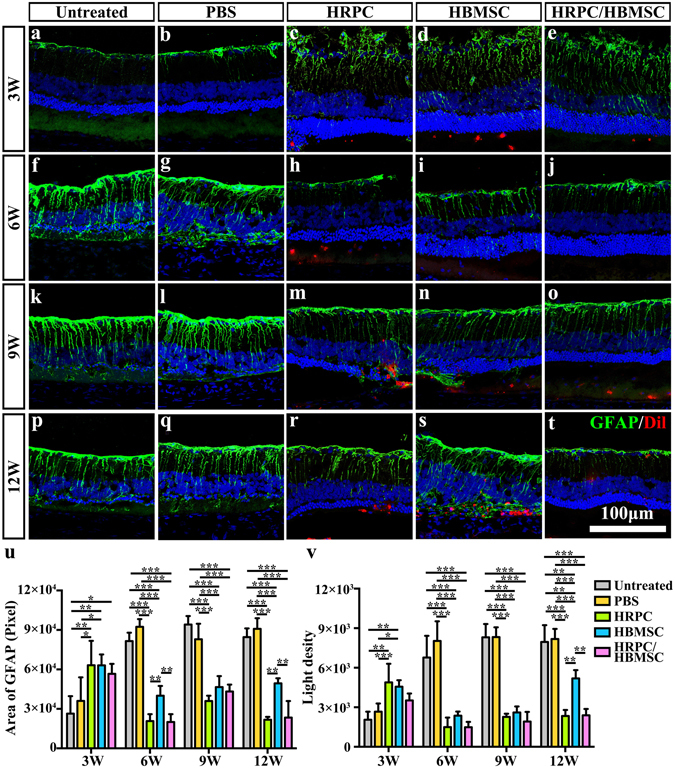
Retinitis pigmentosa (RP) is one of hereditary retinal diseases characterized by the loss of photoreceptors. Cell transplantation has been clinically applied to treat RP patients. Human retinal progenitor cells (HRPCs) and human bone marrow-derived mesenchymal stem cells (HBMSCs) are the two commonly and practically used stem cells for transplantation. Since combined transplantation could be a promising way to integrate the advantages of both stem cell types, we transplanted HRPCs and HBMSCs into the subretinal space (SRS) of Royal College of Surgeons (RCS) rats. We report that HRPCs/HBMSCs combined transplantation maintains the electroretinogram results much better than HRPCs or HBMSCs single transplantations. The thickness of outer nuclear layer also presented a better outcome in the combined transplantation. Importantly, grafted cells in the combination migrated better, both longitudinally and latitudinally, than single transplantation. The photoreceptor differentiation of grafted cells in the retina of RCS rats receiving combined transplantation also showed a higher ratio than single transplantation. Finally, activation of microglia and the gliosis of Müller cells were more effectively suppressed in combined transplantation, indicating better immunomodulatory and anti-gliosis effects. Taken together, combining the transplantation of HRPCs and HBMSCs is a more effective strategy in stem cell-based therapy for retinal degenerative diseases.


Conflict of interest statement

The authors declare that they have no competing interests.

Figures

Figure 1
Figure 1
Identification of human retinal progenitor cells (HRPCs). (ao) Five markers including Ki67, Pax6, Sox2, Nestin and GFAP were used to identify the characteristics of HRPCs in passages1, 3 and 5. (ps) Flow cytometry analysis of HRPCs with Pax6, Sox2, Nestin and GFAP. (t) Corresponding statistic analysis of (ao). For Ki67 staining, the significance between P1 and P3 is P = 0.004637. The significance between P1 and P5 is P = 0.000349. The significance between P3 and P5 is P = 0.028506. For SOX2 staining, the significance between P1 and P3 is P = 0.010751. The significance between P1 and P5 is P = 0.000505. The significance between P3 and P5 is P = 0.020324. For GFAP staining, the significance between P1 and P5 is P = 0.000635. The significance between P3 and P5 is P = 0.005400. *P < 0.05; **P < 0.01; ***P < 0.001.
Figure 2
Figure 2
Identification of human bone mesenchymal stem cells (HBMSCs). (ad) Flow cytometry analysis of HBMSCs with CD44, CD73, CD90 and CD105. (eh) Characteristics of HBMSCs. (e,f) Bone-forming test, results showed that there were Alizarin Red S staning mineralized matrixes formed. (g) Adipocyte-differentiating test showed that lipid vesicles were visualized with Oil Red O. (h) Cartilage-forming test showed that Alcian Blue staining cartilage could be visualized. (i) Flow cytometry analysis of negative marker cocktail. Results showed that CD11b, CD19, CD34, CD43 and HLA-DR were negative in the HBMSCs. (j,k) Identification of GFP-lentivirus transfected HBMSCs. (k) Image of GFP showed that more than 80% cells were GFP positive. (j) Flow cytometry analysis of HBMSCs showed that over 90% cells were positive for GFP.
Figure 3
Figure 3
Comparison of electroretinograms (ERG) test after single and combined cell transplantation into subretinal space (SRS). (a,f,k,p) Representative ERG test of untreated RCS rats on 3, 6, 9 and 12 weeks (the same time point with operational groups). (b,g,l,q) Representative ERG test after PBS injection on 3, 6, 9 and 12 post operational weeks. (c,h,m,r) Representative ERG test after human retinal progenitor cells (HRPCs) injection on 3, 6, 9 and 12 post operational weeks. (d,i,n,s) Representative ERG test after human bone mesenchymal stem cells (HBMSCs) injection on 3, 6, 9 and 12 post operational weeks. (e,j,o,t) Representative ERG test after HRPCs and HBMSCs double injection on 3, 6, 9 and 12 post operational weeks. (u) Statistical analysis of the amplitude of ERG a wave in all 5 groups at 4 time points. (v) Statistical analysis of the amplitude of ERG b wave in all 5 groups at 4 time points. Results showed that all cell transplantation groups displayed increases of the ERG amplitude. Combined transplantation showed longest vision-functional rescue effect. *P < 0.05; **P < 0.01; ***P < 0.001. (n = 3).
Figure 4
Figure 4
Comparison of out nucleus layer (ONL) thickness after single and combined cell transplantation into subretinal space (SRS). (a,f,k,p) Representative ONL thickness of untreated RCS rats on 3, 6, 9 and 12 weeks (the same time point with operational groups). (b,g,l,q) Representative image of ONL thickness after PBS injection on 3, 6, 9 and 12 post operational weeks. (c,h,m,r) Representative ONL thickness after human retinal progenitor cells (HRPCs) injection on 3, 6, 9 and 12 post operational weeks. (d,i,n,s) Representative ONL thickness after human bone mesenchymal stem cells (HBMSCs) injection on 3, 6, 9 and 12 post operational weeks. (e,j,o,t) Representative ONL thickness after HRPCs and HBMSCs double injection on 3, 6, 9 and 12 post operational weeks. (q) Corresponding statistical analysis of the ONL thickness in all 5 groups at 4 time points. Results showed that all cell transplantation groups displayed increases of the ONL thickness, which indicated the protection of photoreceptor. Combined transplantation showed longest photoreceptor-protection effect. *P < 0.05; **P < 0.01; ***P < 0.001. (n = 3).
Figure 5
Figure 5
Comparison of cellular migration after single and combined cell transplantation into subretinal space (SRS). (al) Vertical cellular migration of human retinal progenitor cells (HRPCs) and (or) human bone mesenchymal stem cells (HBMSCs) after single and combined cell transplantation to SRS on 3, 6, 9 and 12 post operational weeks. Results showed that vertical cellular migration started earlier in combined transplantation group. Also, more vertically migrated cells could be found in combined transplantation group. (mo) Horizontal cellular migration of HRPCs and HBMSCs after single and combined cell transplantation to SRS on 6 post operational weeks. Results showed that more and broader horizontal cellular migration could be visualized in combined transplantation group. (pq) Corresponding statistical analysis of (al). (r) Corresponding statistical analysis of (m,n). *P < 0.05; **P < 0.01; ***P < 0.001. (n = 3).
Figure 6
Figure 6
Cellular differentiation after single and combined cell transplantation into subretinal space (SRS) on 6 post operational weeks. (ac) Confocal analysis of Recoerin and human mitochondria double staining after single and combined transplantation. (a1,b1,a2,b2) Corresponding Recoerin and human mitochondria single staining. (a’–c’) Enlarged area reflecting the differentiation of transplanted cells. (df) Confocal analysis of Rhodopsin and human mitochondria double staining after single and combined transplantation. (d1–f1,d2–f2) Corresponding Rhodopsin and human mitochondria single staining. (d’–f’) Enlarged area reflecting the differentiation of transplanted cells. Results showed that there are more differentiation happened in HRPCs and HBMSCs combined transplantation group. (n = 3).
Figure 7
Figure 7
Comparison of microglia activation after single and combined cell transplantation into subretinal space (SRS). (ad) Representative image of Iba1-staining microglia within grafted area after PBS, human retinal progenitor cells (HRPCs), human bone mesenchymal stem cells (HBMSCs) and combined cells injection on 3 post operational weeks. (eh) Representative image of Iba1-staining microglia within para-grafted area after PBS, HRPCs, HBMSCs and combined cells injection on 6 post operational weeks. (il) Representative image of Iba1-staining microglia within grafted area after PBS, HRPCs, HBMSCs and combined cells injection on 3 post operational weeks. (mp) Representative image of Iba1-staining microglia within para-grafted area after PBS, HRPCs, HBMSCs and combined cells injection on 6 post operational weeks. (q) Corresponding statistical analysis of (ap). GA: grafted area. PGA: Para-grafted area. (r) Western blot analysis of Iba1 protein on post operational 3 and 6 weeks (a’: PBS; b’: HRPCs; c’: HBMSCs; d’: HRPCs/HBMSCs). For original uncropped images, please see Supplementary Figs 2 and 3. (s) Corresponding statistical analysis of (r). *P < 0.05; **P < 0.01; ***P < 0.001. (n = 3).
Figure 8
Figure 8
Comparison of retinal gliosis after single and combined cell transplantation into subretinal space (SRS). (at) Representative image of GFAP-staining Müller cells in untreated group and within grafted area after PBS, human retinal progenitor cells (HRPCs), human bone mesenchymal stem cells (HBMSCs) and combined cells injection on corresponding 3, 6, 9 and 12 post operational weeks. (u) Statistical analysis of the area of total GFAP positive cells the in all 5 groups at 4 time points. (v) Statistical analysis of the light density of GFAP positive cells the in all 5 groups at 4 time points. *P < 0.05; **P < 0.01; ***P < 0.001. (n = 3).

Similar articles

Cited by

References

    1. Hartong DT, Berson EL, Dryja TP. Retinitis pigmentosa. Lancet. 2006;368:1795–1809. doi: 10.1016/S0140-6736(06)69740-7. - DOI - PubMed
    1. Bunker CH, Berson EL, Bromley WC, Hayes RP, Roderick TH. Prevalence of retinitis pigmentosa in Maine. Am. J. Ophthalmol. 1984;97:357–365. doi: 10.1016/0002-9394(84)90636-6. - DOI - PubMed
    1. Milam AH, Li ZY, Fariss RN. Histopathology of the human retina in retinitis pigmentosa. Prog. Retin. Eye Res. 1998;17:175–205. doi: 10.1016/S1350-9462(97)00012-8. - DOI - PubMed
    1. Berson EL, et al. A randomized trial of vitamin A and vitamin E supplementation for retinitis pigmentosa. Arch. Ophthalmol. 1993;111:761–772. doi: 10.1001/archopht.1993.01090060049022. - DOI - PubMed
    1. Berson EL, et al. Further evaluation of docosahexaenoic acid in patients with retinitis pigmentosa receiving vitamin A treatment: subgroup analyses. Arch. Ophthalmol. 2004;122:1306–1314. doi: 10.1001/archopht.122.9.1306. - DOI - PubMed

Publication types

MeSH terms