

The combination of three-dimensional and rotary cell culture system promotes the proliferation and maintains the differentiation potential of rat BMSCs
- PMID: 28298644
- PMCID: PMC5428343
- DOI: 10.1038/s41598-017-00087-x
The combination of three-dimensional and rotary cell culture system promotes the proliferation and maintains the differentiation potential of rat BMSCs
Abstract
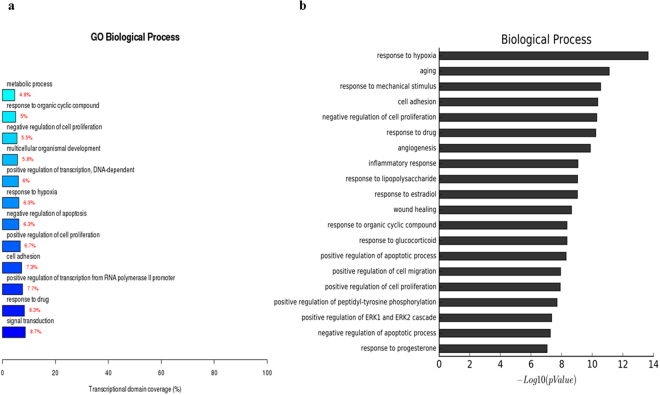
Bone marrow mesenchymal stem cells (BMSCs) are a good candidate for tissue engineering and clinical application. One of the challenges in its cell therapy is how to quickly obtain an adequate number of seed cells and meanwhile maintain suitable differentiation potential. In this study we combined three-dimensional (3D) collagen porous scaffolds with rotary cell culture system (RCCS) (RCCS-3D) to create a stereoscopic dynamic environment for the amplification of rat BMSCs in vitro. The results revealed that this RCCS-3D system could enhance BMSCs' proliferation and colony formation, as well as maintain the differentiation potential compared with conventional static two-dimensional (2D) and 3D cell culture conditions. In addition, high-throughput microarray analysis showed that gene expressions of RCCS-3D system displayed significant differences in cell proliferation and differentiation compared with static-2D conditions. Thus, RCCS-3D system could provide an effective means for BMSCs cell proliferation in vitro and meanwhile maintain differentiation potential in tissue engineering.
Conflict of interest statement
The authors declare that they have no competing interests.
Figures


Similar articles
-
3D Culture of MSCs on a Gelatin Microsphere in a Dynamic Culture System Enhances Chondrogenesis.Int J Mol Sci. 2020 Apr 13;21(8):2688. doi: 10.3390/ijms21082688. Int J Mol Sci. 2020. PMID: 32294921 Free PMC article.
-
Bone marrow-derived mesenchymal stem cells in three-dimensional culture promote neuronal regeneration by neurotrophic protection and immunomodulation.J Biomed Mater Res A. 2016 Jul;104(7):1759-69. doi: 10.1002/jbm.a.35708. Epub 2016 Mar 21. J Biomed Mater Res A. 2016. PMID: 26990583
-
Chondrogenic differentiation of ChM-I gene transfected rat bone marrow-derived mesenchymal stem cells on 3-dimensional poly (L-lactic acid) scaffold for cartilage engineering.Cell Biol Int. 2015 Mar;39(3):300-9. doi: 10.1002/cbin.10393. Epub 2014 Dec 17. Cell Biol Int. 2015. PMID: 25319137
-
Osteoinduction and proliferation of bone-marrow stromal cells in three-dimensional poly (ε-caprolactone)/ hydroxyapatite/collagen scaffolds.J Transl Med. 2015 May 8;13:152. doi: 10.1186/s12967-015-0499-8. J Transl Med. 2015. PMID: 25952675 Free PMC article.
-
[Effect of indianhedgehog gene transfection into rabbit bone marrow mesenchymal stem cells in promoting chondrogenic differentiation and inhibiting cartilage aging in rotary cell culture system].Zhongguo Xiu Fu Chong Jian Wai Ke Za Zhi. 2016 Jul 8;30(7):892-902. doi: 10.7507/1002-1892.20160180. Zhongguo Xiu Fu Chong Jian Wai Ke Za Zhi. 2016. PMID: 29786328 Chinese.
Cited by
-
Three-Dimensional In Vitro Cell Culture Models for Efficient Drug Discovery: Progress So Far and Future Prospects.Pharmaceuticals (Basel). 2022 Jul 27;15(8):926. doi: 10.3390/ph15080926. Pharmaceuticals (Basel). 2022. PMID: 36015074 Free PMC article. Review.
-
May the Force Be with You (Or Not): The Immune System under Microgravity.Cells. 2021 Jul 30;10(8):1941. doi: 10.3390/cells10081941. Cells. 2021. PMID: 34440709 Free PMC article. Review.
-
Combination of optimized tissue engineering bone implantation with heel-strike like mechanical loading to repair segmental bone defect in New Zealand rabbits.Cell Tissue Res. 2021 Sep;385(3):639-658. doi: 10.1007/s00441-021-03458-z. Epub 2021 May 8. Cell Tissue Res. 2021. PMID: 33966092
-
Mouse placental scaffolds: a three-dimensional environment model for recellularization.J Tissue Eng. 2019 Aug 8;10:2041731419867962. doi: 10.1177/2041731419867962. eCollection 2019 Jan-Dec. J Tissue Eng. 2019. PMID: 31448074 Free PMC article.
-
Cell Culture Model Evolution and Its Impact on Improving Therapy Efficiency in Lung Cancer.Cancers (Basel). 2023 Oct 15;15(20):4996. doi: 10.3390/cancers15204996. Cancers (Basel). 2023. PMID: 37894363 Free PMC article. Review.
References
Publication types
MeSH terms
LinkOut - more resources
Full Text Sources
Other Literature Sources
Medical
