. 2017 Mar 1:8:203.
doi: 10.3389/fimmu.2017.00203. eCollection 2017.

Cathepsin E Deficiency Ameliorates Graft-versus-Host Disease and Modifies Dendritic Cell Motility

Affiliations

Cathepsin E Deficiency Ameliorates Graft-versus-Host Disease and Modifies Dendritic Cell Motility

Jörg Mengwasser et al. Front Immunol. .

Abstract

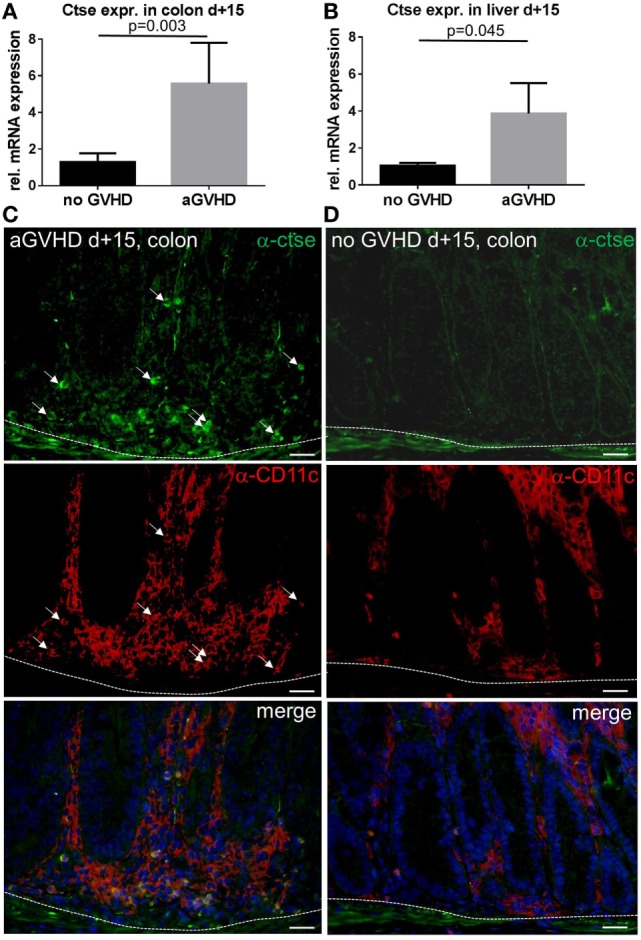
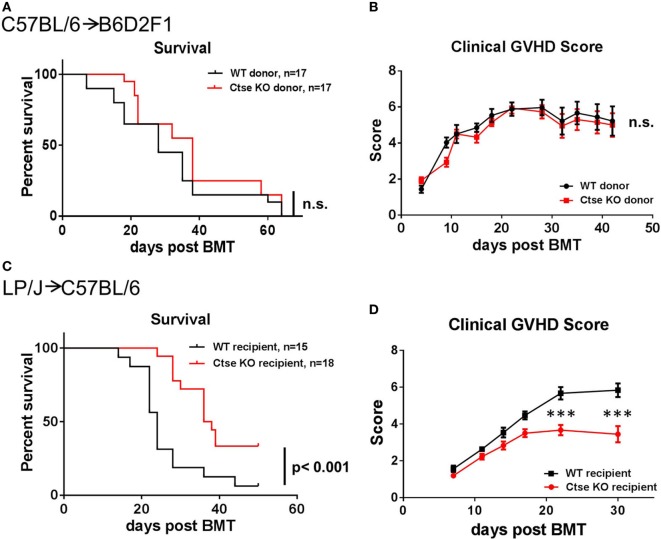
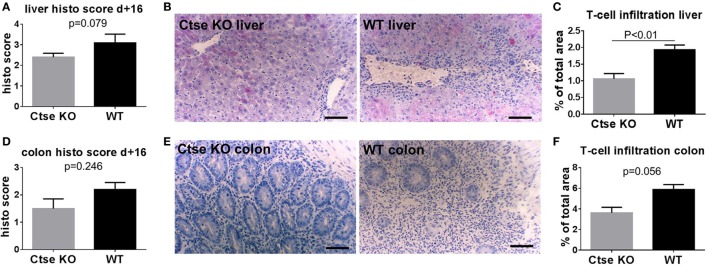
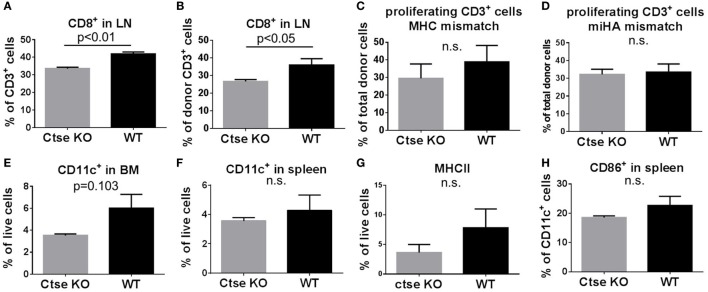
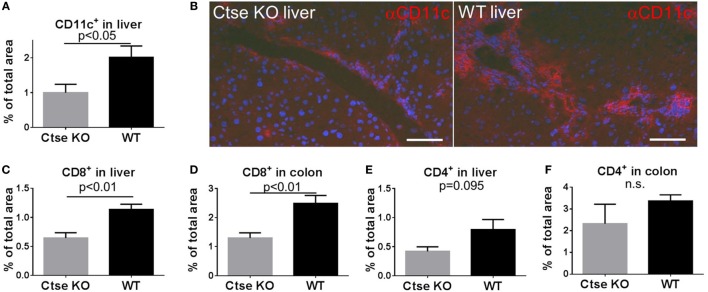
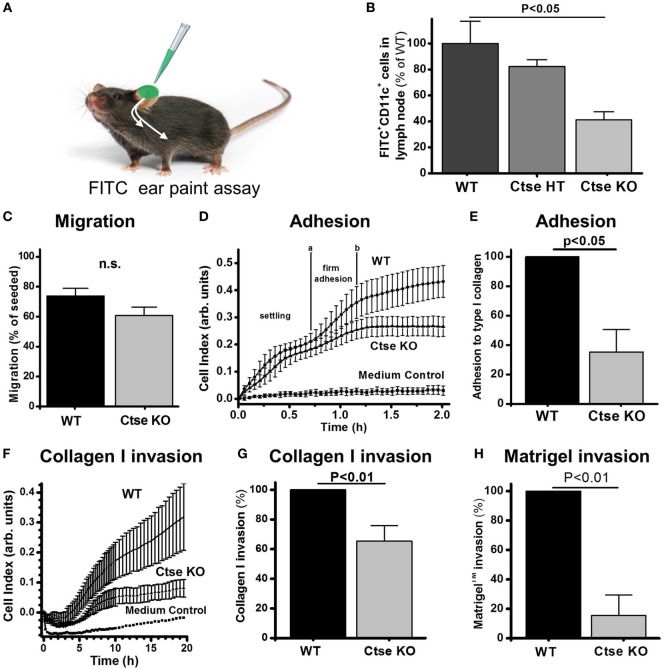
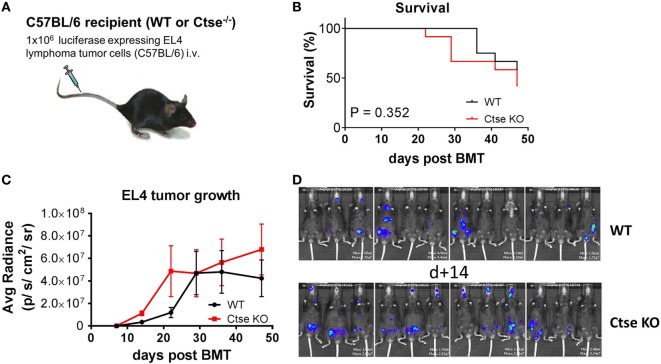
Microbial products influence immunity after allogeneic hematopoietic stem cell transplantation (allo-SCT). In this context, the role of cathepsin E (Ctse), an aspartate protease known to cleave bacterial peptides for antigen presentation in dendritic cells (DCs), has not been studied. During experimental acute graft-versus-host disease (GVHD), we found infiltration by Ctse-positive immune cells leading to higher Ctse RNA- and protein levels in target organs. In Ctse-deficient allo-SCT recipients, we found ameliorated GVHD, improved survival, and lower numbers of tissue-infiltrating DCs. Donor T cell proliferation was not different in Ctse-deficient vs. wild-type allo-SCT recipients in MHC-matched and MHC-mismatched models. Furthermore, Ctse-deficient DCs had an intact ability to induce allogeneic T cell proliferation, suggesting that its role in antigen presentation may not be the main mechanism how Ctse impacts GVHD. We found that Ctse deficiency significantly decreases DC motility in vivo, reduces adhesion to extracellular matrix (ECM), and diminishes invasion through ECM. We conclude that Ctse has a previously unrecognized role in regulating DC motility that possibly contributes to reduced DC counts and ameliorated inflammation in GVHD target organs of Ctse-deficient allo-SCT recipients. However, our data do not provide definite proof that the observed effect of Ctse-/- deficiency is exclusively mediated by DCs. A contribution of Ctse-/--mediated functions in other recipient cell types, e.g., macrophages, cannot be excluded.

Keywords: GVHD; HSCT; cathepsin E; dendritic cells; motility.


Figures

Figure 1
Figure 1
Cathepsin E (Ctse) expression is increased in target organs during graft-versus-host disease (GVHD). (A,B) Ctse mRNA expression assessed by qPCR in colon and liver during acute GVHD [aGVHD, allogeneic stem cell transplantation; allogeneic hematopoietic stem cell transplantation (allo-SCT)], and syngeneic transplanted control animals (no GVHD, syn-SCT) at day +15 after allo-SCT in the LP/J→C57BL/6 model. Ctse expression is shown relative to the no GVHD control group. n = 5 per group (C,D) Ctse protein expression is elevated in immune cell infiltrates in the colon during acute GVHD (aGVHD) compared to syn-SCT recipients without GVHD (no GVHD). Ctse expression is shown in green, CD11c is shown in red, nuclear counterstain with DAPI is shown in blue, Ctse-expressing cells are highlighted with white arrows, same arrow positions are shown in the CD11c staining, illustrating that Ctse-positive cells are also CD11c+. Dotted line marks the border of the lamina propria to the lamina muscularis mucosae. Fluorescence images were taken using a Motic BA410 microscope with a Moticam Pro 285B and the Motic Images Plus 2.0 software. The used objective was a Plan Fluar 40×/0.75. Error bars indicate mean ± SEM, p-values in (A,B) were calculated using a double-sided Student’s t-test. Bar = 50 μm.
Figure 2
Figure 2
Lethal graft-versus-host disease (GVHD) is reduced in cathepsin E (Ctse)-deficient allogeneic hematopoietic stem cell transplantation recipients. (A,B) No significant differences were observed when wild-type (WT) and Ctse−/− (Ctse KO) C57Bl/6 were used as donors in the C57BL/6→B6D2F1 model. (C,D) WT and Ctse−/− C57Bl/6 mice were used as recipients in the LP/J→C57BL/6 model. (A,C) Survival curves. (B,D) Cumulated clinical score (posture, movement, fur, skin, weight; single score: 0–2, max. score: 10). Error bars indicate mean ± SEM, p-values in (A,C) were calculated using a log-rank (Mantel–Cox) test, ***p < 0.001.
Figure 3
Figure 3
Histopathological scores and T cell infiltration is reduced in cathepsin E (Ctse)−/− allogeneic hematopoietic stem cell transplantation (allo-SCT) recipients. (A,D) Score of histopathological analysis of liver and colon sections at day +16 after allo-SCT in wild-type (WT) vs. Ctse−/− allo-SCT recipients. (B,E) Examples of H + E stainings of liver and colon sections from Ctse−/− vs. WT allo-SCT recipients. (C,F) Analysis of T cell infiltration into liver and colon at day +16 after allo-SCT, measured by labeled lymphocyte immunofluorescence area of total liver area or total colon mucosal area in WT and Ctse−/− allo-SCT recipients at day +16. n = 5 for all experiments. For immunofluorescence T cell infiltration analysis, six pictures per animal were taken. Bright-field images were taken using a Motic BA410 microscope with a Moticam Pro 285B and the Motic Images Plus 2.0 software. The used objective was a Plan Fluar 20×/0.50. Error bars indicate mean ± SEM, p-values were calculated using Wilcoxon–Mann–Whitney rank sum test. Bar = 100 μm.
Figure 4
Figure 4
Quantification of T cell number, T cell proliferation, and dendritic cell number in wild-type (WT) vs. cathepsin E (Ctse)−/− allogeneic hematopoietic stem cell transplantation (allo-SCT) recipients. WT vs. Ctse−/− C57Bl/6 mice were used as SCT recipients. (A,B) Quantification of CD8+ cells in lymph nodes of Ctse−/− and WT recipients on day +16 after allo-SCT in the LP/J→C57BL/6 model. (C,D) In vivo proliferation assay with CFSE labeled Balb/C MHC-mismatched (C) or 129J miHA-mismatched (D) CD3+ lymphocytes. The percentage of proliferating CD3+ donor T cells is shown. (E–H) Analyses during established graft-versus-host disease at day +16 after allo-SCT in the LP/J→C57BL/6 model. (E,F) Quantification of CD11c+ cells in spleen and bone marrow from Ctse−/− vs. WT allo-SCT recipients. (G) Quantification of MHC II+ host cells in the spleen of Ctse−/− vs. WT allo-SCT recipients. (H) Quantification of CD86+ host cells in the spleen of Ctse−/− vs. WT allo-SCT recipients. Data were obtained with applying the markers of interest to the live cell gate. n = 5 animals per group and per experiment. Error bars indicate mean ± SEM, p-values were calculated using Wilcoxon–Mann–Whitney rank sum test.
Figure 5
Figure 5
Reduced CD11c+ and CD8+ cell counts in graft-versus-host disease target organs of cathepsin E (Ctse)-deficient allogeneic hematopoietic stem cell transplantation (allo-SCT) recipients. (A,B) Analysis of CD11c-expressing cells in cryosections of Ctse−/− vs. wild-type(WT) allo-SCT recipients on day +16 after SCT in the LP/J→C57BL/6 model. (B) Representative images of CD11c IF labeling in liver of Ctse−/− vs. WT allo-SCT recipients. (C–F) Analysis of CD4+ or CD8+ T cell infiltration into colon and liver of Ctse−/− vs. WT allo-SCT recipients, measured by labeled lymphocyte immunofluorescence area of total liver area or total colon mucosal area. n = 5 animals per group and per experiment. Fluorescence images were taken using a Motic BA410 microscope with a Moticam Pro 285B and the Motic Images Plus 2.0 software. The used objective was a Plan Fluar 40×/0.75. Error bars indicate mean ± SEM, p-values were calculated using Wilcoxon–Mann–Whitney rank sum test. Bar = 50 μm.
Figure 6
Figure 6
Cathepsin E (Ctse)-deficient dendritic cells (DCs) show impaired adhesion and invasion potential. (A) Experimental setup of determination of FITC-labeled DC (FITC+ CD11c+) migration to draining lymph nodes. Measurement was done 24 h after local application of irritant-solved FITC to the ear skin. (B) Quantification of FITC+ CD11c+ cells in the lymph nodes of Ctse+/+ (n = 11), Ctse+/− (n = 3), and Ctse−/− (n = 11) mice. (C) DC migration through a porous uncoated membrane in a Boyden Chamber (n = 3). (D–H) Adhesion and invasion was quantified by impedance measurements using the xCelligence system (ACEA) and plotted as Cell Index. (D) Representative adhesion measurement on collagen I coated surface. The slope between the time points a and b, where firm adhesion occurs, was further analyzed. (E) Quantification of DC adhesion on collagen I (n = 3). (F) Representative invasion assay through a layer of collagen I in presence of LPS in the upper well and CCL19 and CCL21 in the lower well. (G) Quantification of DC invasion through collagen I (1.73 mg/ml; n = 3), and (H) Matrigel™ (9 mg/ml; n = 3). Error bars indicate mean ± SD, p-values were calculated using non-parametric Kruskal–Wallis ANOVA and a post hoc Mann–Whitney U-test (B), the two-sided two sample t-test (C) or two-sided one-sample t-test for the normalized data in panels (E,G,H).
Figure 7
Figure 7
Analysis of EL4 T cell lymphoma growth in untreated cathepsin E (Ctse)-deficient mice vs. wild-type (WT) mice. C57Bl/6 WT or Ctse KO mice were injected intravenously with 1 × 106 luciferase-expressing EL4 tumor cells. (A) Schematic representation of the tumor model. (B) Survival curve of WT and Ctse−/− (Ctse KO) mice after EL4 lymphoma cell injection, statistical analysis was done using the Mantel–Cox log-rank test. (C) Average radiance data of WT and Ctse−/− mice after tumor cell injection. n = 12 per group. Error bars indicate mean ± SEM. Day 14 after tumor challenge p < 0.01; all other time points not significant. (D) Pictures of WT and Ctse−/− mice on day 14 after EL4 T cell lymphoma injection.

Similar articles

Cited by

References

    1. Mathewson ND, Jenq R, Mathew AV, Koenigsknecht M, Hanash A, Toubai T, et al. Gut microbiome-derived metabolites modulate intestinal epithelial cell damage and mitigate graft-versus-host disease. Nat Immunol (2016) 17:505–13.10.1038/ni.3400 - DOI - PMC - PubMed
    1. Penack O, Holler E, van den Brink MR. Graft-versus-host disease: regulation by microbe-associated molecules and innate immune receptors. Blood (2010) 115:1865–72.10.1182/blood-2009-09-242784 - DOI - PubMed
    1. Penack O, Smith OM, Cunningham-Bussel A, Liu X, Rao U, Yim N, et al. NOD2 regulates hematopoietic cell function during graft-versus-host disease. J Exp Med (2009) 206:2101–10.10.1084/jem.20090623 - DOI - PMC - PubMed
    1. Shono Y, Docampo MD, Peled JU, Perobelli SM, Velardi E, Tsai JJ, et al. Increased GVHD-related mortality with broad-spectrum antibiotic use after allogeneic hematopoietic stem cell transplantation in human patients and mice. Sci Transl Med (2016) 8:339ra371.10.1126/scitranslmed.aaf2311 - DOI - PMC - PubMed
    1. Weber D, Oefner PJ, Hiergeist A, Koestler J, Gessner A, Weber M, et al. Low urinary indoxyl sulfate levels early after transplantation reflect a disrupted microbiome and are associated with poor outcome. Blood (2015) 126:1723–8.10.1182/blood-2015-04-638858 - DOI - PubMed