. 2016 Dec 1:5:2806.
doi: 10.12688/f1000research.9434.1. eCollection 2016.

DWCox: A density-weighted Cox model for outlier-robust prediction of prostate cancer survival

Affiliations

DWCox: A density-weighted Cox model for outlier-robust prediction of prostate cancer survival

Jinfeng Xiao et al. F1000Res. .

Abstract

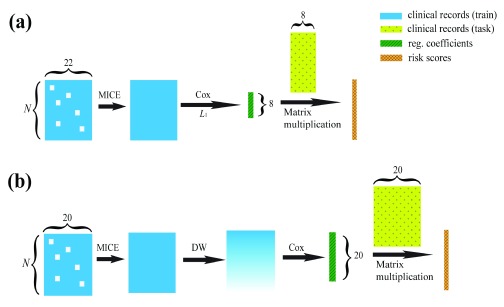
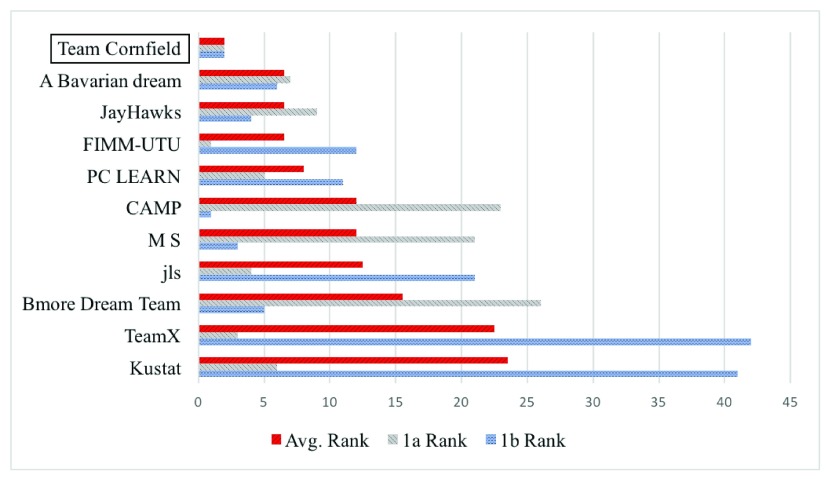
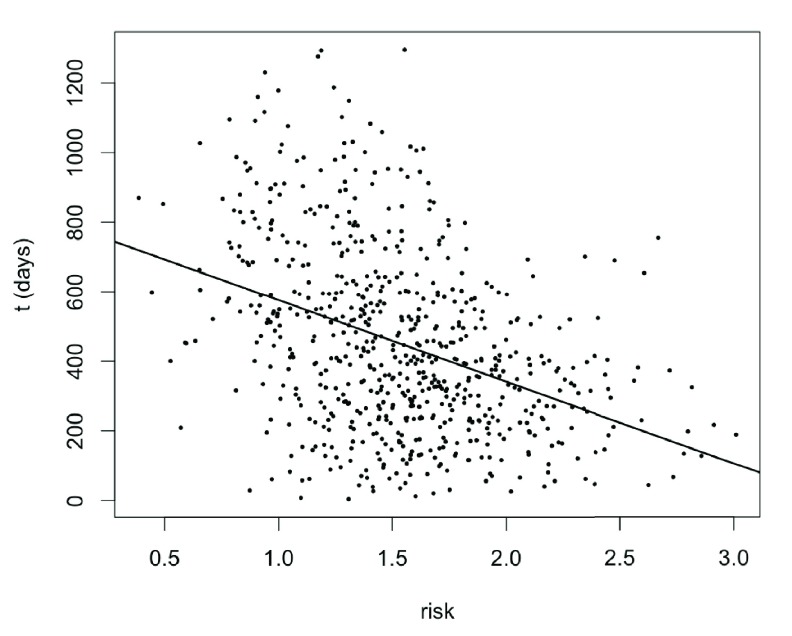
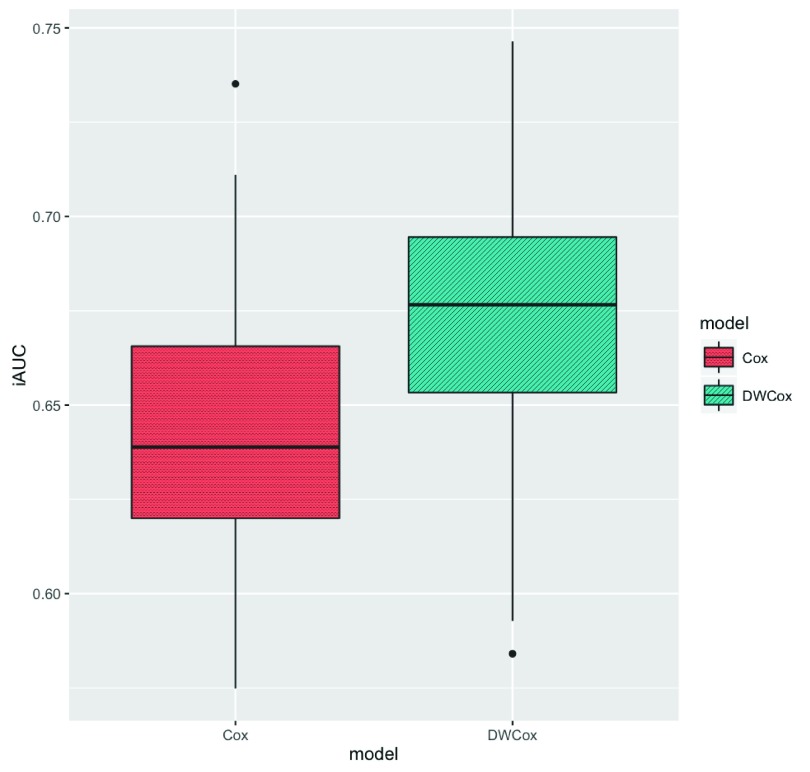
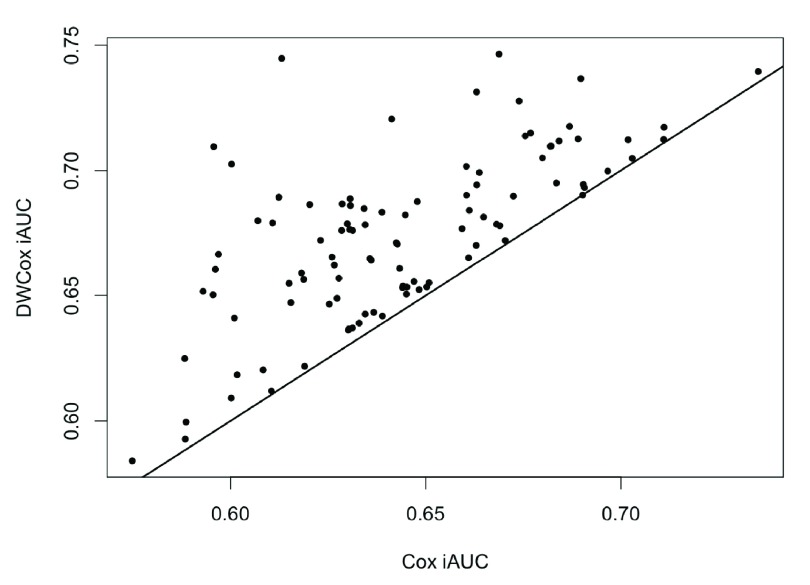
Reliable predictions on the risk and survival time of prostate cancer patients based on their clinical records can help guide their treatment and provide hints about the disease mechanism. The Cox regression is currently a commonly accepted approach for such tasks in clinical applications. More complex methods, like ensemble approaches, have the potential of reaching better prediction accuracy at the cost of increased training difficulty and worse result interpretability. Better performance on a specific data set may also be obtained by extensive manual exploration in the data space, but such developed models are subject to overfitting and usually not directly applicable to a different data set. We propose DWCox, a density-weighted Cox model that has improved robustness against outliers and thus can provide more accurate predictions of prostate cancer survival. DWCox assigns weights to the training data according to their local kernel density in the feature space, and incorporates those weights into the partial likelihood function. A linear regression is then used to predict the actual survival times from the predicted risks. In the 2015 Prostate Cancer DREAM Challenge, DWCox obtained the best average ranking in prediction accuracy on the risk and survival time. The success of DWCox is remarkable given that it is one of the smallest and most interpretable models submitted to the challenge. In simulations, DWCox performed consistently better than a standard Cox model when the training data contained many sparsely distributed outliers. Although developed for prostate cancer patients, DWCox can be easily re-trained and applied to other survival analysis problems. DWCox is implemented in R and can be downloaded from https://github.com/JinfengXiao/DWCox.

Keywords: Cox model; DREAM; Prostate cancer.


Conflict of interest statement

Competing interests: No competing interests were disclosed.

Figures

Figure 1.
Figure 1.. Illustration of how Halabi’s model (a) and DWCox (b) predict the risk scores.
DWCox is also able to predict the days to death using linear regression with the risk scores (not demonstrated in this figure). N: number of patients. MICE: Multivariate Imputation by Chained Equations. L 1: Lasso regularization. DW: Density-based weighting. Note that the objective functions in the Cox step of ( a) and ( b) are different, as discussed in the main text.
Figure 2.
Figure 2.. Scatter plot of the first two principle components of the signal, noise and validation groups in a simulated data set.
Each point represents a patient. The shapes mark the mean of each group. (Best viewed in color).
Figure 3.
Figure 3.. Heatmap of the percentage missing of the 20 clinical features used in DWCox.
Figure 4.
Figure 4.. Scatter plot of the first two principle components of the four prostate cancer trials.
Each point represents a patient. The shapes mark the average values of each trial.
Figure 5.
Figure 5.. Ranking of the top teams in sub-challenges 1a & 1b.
The six best teams of each sub-challenge are included. DWCox was submitted by the authors’ Team Cornfield.
Figure 6.
Figure 6.. Scatter plot of the uncensored survival time versus the predicted risk on the PCDC training data.
The straight line is the linear regression line with slope = -234.6, intercept = 810.3 and adjusted R 2 = 0.1513.
Figure 7.
Figure 7.. Boxplot of the iAUC of DWCox and a standard Cox model in 100 simulations.
The boxes show the medians and inter-quartile ranges (IQR). The vertical black lines extends from the boxes by at most 1.5 IQR. Black points represent experiments whose iAUC is more than 1.5 IQR away from the boxes.
Figure 8.
Figure 8.. DWCox iAUC vs the standard Cox iAUC in 100 simulations.
Each point is given by a simulation. The straight line has slope = 1 and intercept = 0.

Similar articles

References

    1. Siegel RL, Miller KD, Jemal A: Cancer statistics, 2015. CA Cancer J Clin. 2015;65(1):5–29. 10.3322/caac.21254 - DOI - PubMed
    1. Garcia M, Jemal A, Ward EM, et al. : Global cancer facts & figures 2007. Atlanta, GA: American cancer society. 2007;1(3):52 Reference Source
    1. Cox DR: Regression models and life-tables. In Breakthroughs in statistics.Springer,1992;527–541. 10.1007/978-1-4612-4380-9_37 - DOI
    1. Halabi S, Lin CY, Kelly WK, et al. : Updated prognostic model for predicting overall survival in first-line chemotherapy for patients with metastatic castration-resistant prostate cancer. J Clin Oncol. 2014;32(7):671–677. 10.1200/JCO.2013.52.3696 - DOI - PMC - PubMed
    1. van Buuren S, Boshuizen HC, Knook DL, et al. : Multiple imputation of missing blood pressure covariates in survival analysis. Stat Med. 1999;18(6):681–694. 10.1002/(SICI)1097-0258(19990330)18:6<681::AID-SIM71>3.0.CO;2-R - DOI - PubMed

LinkOut - more resources