. 2017:2017:1829685.
doi: 10.1155/2017/1829685. Epub 2017 Feb 16.

RNA-Based Stable Isotope Probing Suggests Allobaculum spp. as Particularly Active Glucose Assimilators in a Complex Murine Microbiota Cultured In Vitro

Affiliations

RNA-Based Stable Isotope Probing Suggests Allobaculum spp. as Particularly Active Glucose Assimilators in a Complex Murine Microbiota Cultured In Vitro

Elena Herrmann et al. Biomed Res Int. 2017.

Abstract

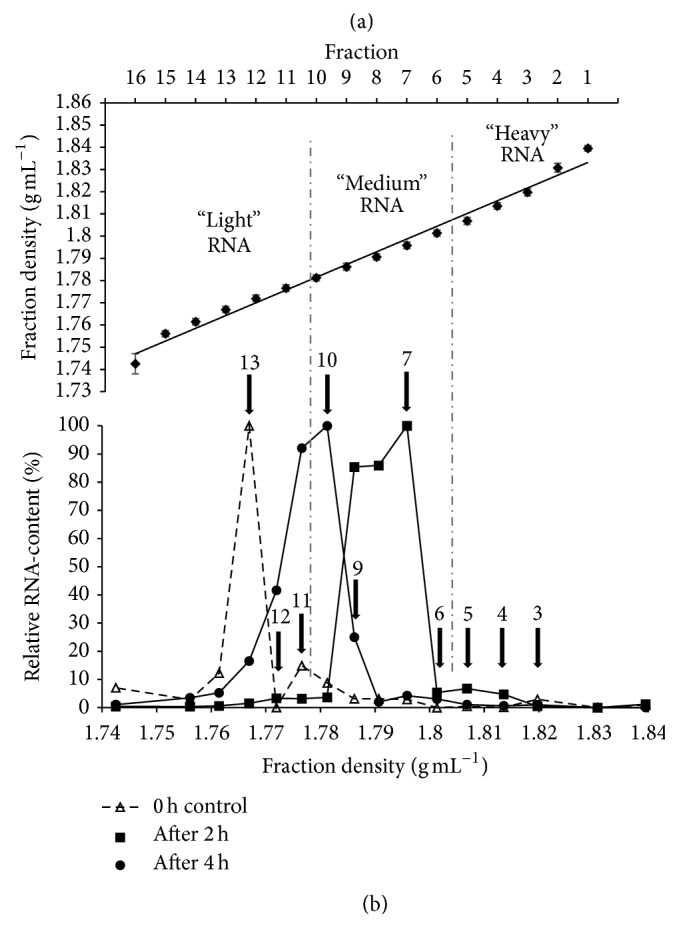
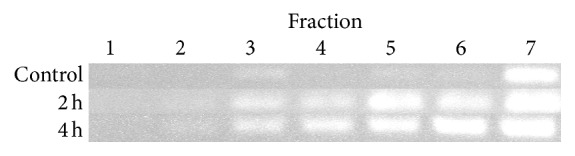
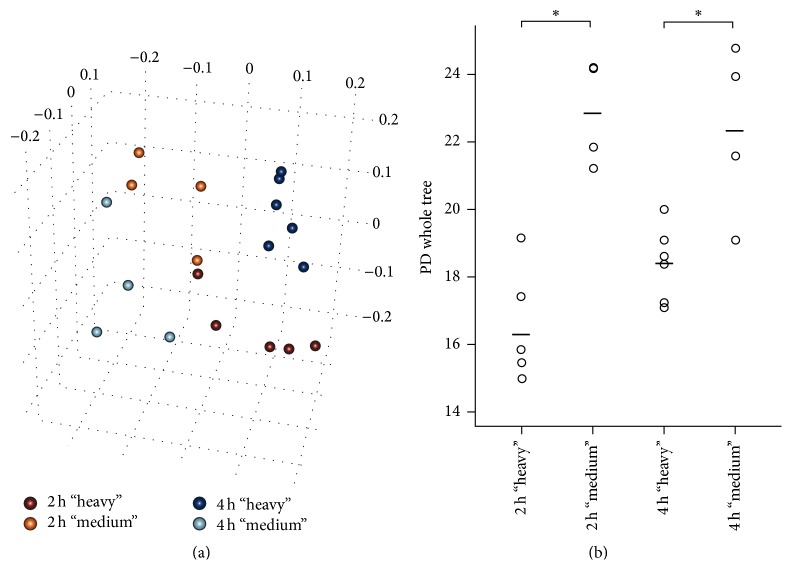
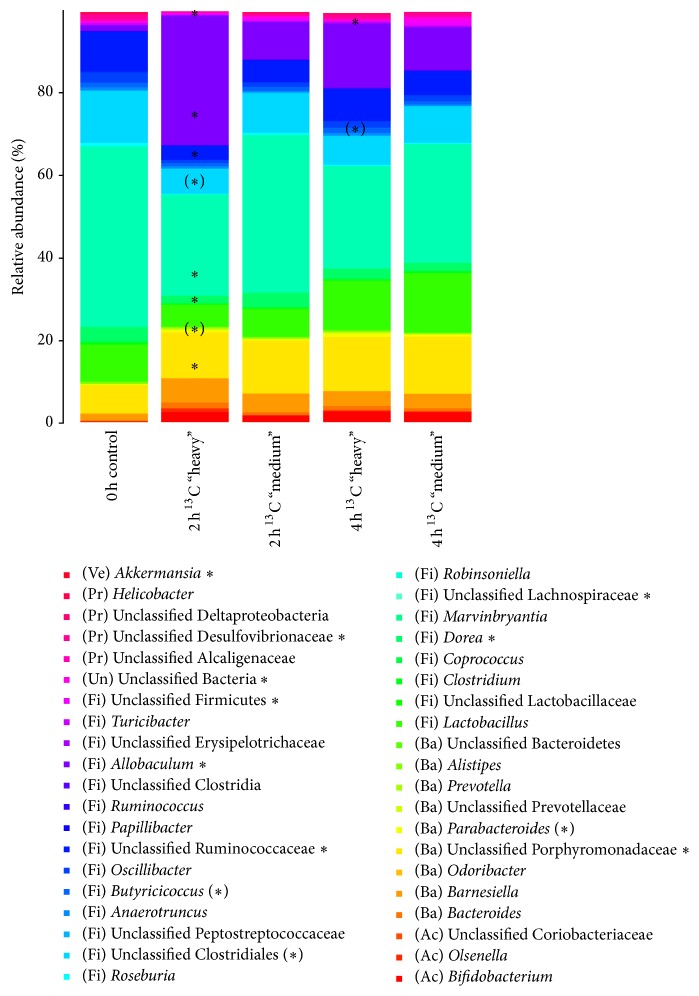
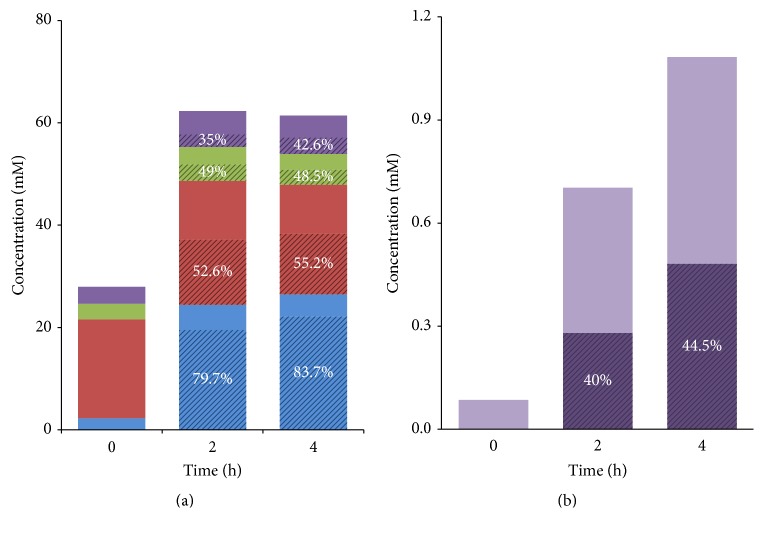
RNA-based stable isotope probing (RNA-SIP) and metabolic profiling were used to detect actively glucose-consuming bacteria in a complex microbial community obtained from a murine model system. A faeces-derived microbiota was incubated under anaerobic conditions for 0, 2, and 4 h with 40 mM [U13C]glucose. Isopycnic density gradient ultracentrifugation and fractionation of isolated RNA into labeled and unlabeled fractions followed by 16S rRNA sequencing showed a quick adaptation of the bacterial community in response to the added sugar, which was dominated by unclassified Lachnospiraceae species. Inspection of distinct fractions of isotope-labeled RNA revealed Allobaculum spp. as particularly active glucose utilizers in the system, as the corresponding RNA showed significantly higher proportions among the labeled RNA. With time, the labeled sugar was used by a wider spectrum of faecal bacteria. Metabolic profiling indicated rapid fermentation of [U13C]glucose, with lactate, acetate, and propionate being the principal 13C-labeled fermentation products, and suggested that "cross-feeding" occurred in the system. RNA-SIP combined with metabolic profiling of 13C-labeled products allowed insights into the microbial assimilation of a general model substrate, demonstrating the appropriateness of this technology to study assimilation processes of nutritionally more relevant substrates, for example, prebiotic carbohydrates, in the gut microbiota of mice as a model system.


Conflict of interest statement

The authors declare that they have no competing interests.

Figures

Figure 1
Figure 1
Density gradient formation and RNA distribution. (a) Buoyant densities (BD) of gradient fractions averaged over 12 gradients. The standard error of the mean (SEM) for each fraction was ≤0.0045 g mL−1. Vertical dash-dot lines classify the division of the gradients into “heavy” (fractions 1–5; BD 1.84–1.807 g mL−1), “medium” (fractions 6–10; BD 1.801–1.781 g mL−1), and “light” RNA fractions (fractions 11–16; BD 1.777–1.743 g mL−1). (b) Density-dependent RNA concentration in gradient fractions of the 40 mM [U13C]glucose cultures and the uncultured control. RNA was isolated from mice faeces at the start of the incubation (0 h control), after 2 h, and after 4 h from the [U13C] in vitro cultures, and resolved in a density gradient solution by ultracentrifugation. Separated RNA was harvested and quantified with a RiboGreen low range assay. To facilitate comparison between the gradients, the RNA content is given in relative units (%; fraction with the highest RNA concentration per gradient was set as 100%) [23]. Arrows indicate the gradient fractions, which were chosen for further downstream analysis by NGS.
Figure 2
Figure 2
PCR analysis of selected gradient fractions. PCR amplification of cDNA reverse-transcribed from bacterial 16S rRNA harvested from gradient fractions 1–7 in a PCR assay resulted in an ~550 bp fragment with increased amounts of amplicons in “heavy” RNA-SIP fractions for the 2 h and 4 h incubations with [U13C]glucose. The fractions covered a BD spectrum from 1.84 g mL−1(fraction 1) to 1.796 g mL−1 (fraction 7). The picture is combined from three stained agarose gels after electrophoresis of the 16S RNA amplicons. For simplification, the size standard is not shown. All gels contained the same volume of PCR mixture. Faint bands in fractions 3 (uncultured control, 0 h) and 2 (2 h and 4 h 13C-cultures) represent low amounts of RNA amplicons which were not suitable for further analyses.
Figure 3
Figure 3
Bacterial diversity in the faecal microbiota. (a) Principal coordinate analysis (PCoA) of unweighted UniFrac phylogenetic distances of mouse faecal microbiota based upon different density RNA-SIP fractions. “Heavy” RNA-SIP fractions in comparison with the “medium” majority of the bacterial community of the 2 h and 4 h incubations in the presence of [U13C]glucose are shown. Each fraction was sequenced in duplicate (except fraction 3 of the 2 h incubation, where only one sample was usable for sequencing) and is represented as an individual point. (b) Faith's phylogenetic diversity estimate of “heavy” RNA-SIP fractions and the “medium” majority of the community of the 2 h and 4 h incubations, respectively. Each fraction was sequenced in duplicate (except fraction 3 of the 2 h incubation, where only one sample was usable for sequencing) and is displayed as an individual data point. Lines indicate the mean across the sequencing replicates and the designated different density fractions. indicates significant difference (p < 0.01) in complexity determined by two-way ANOVA.
Figure 4
Figure 4
Relative abundance of bacterial taxa in different density RNA-SIP fractions. Stacked barplots showing the average community composition of different density RNA-SIP fractions from the uncultured control (0 h control) and from the 2 h and 4 h incubations in minimal medium with 40 mM [U13C]glucose. Shown are the 40 taxa with the highest mean relative abundance across all samples. indicates abundant taxa that are significantly different (p < 0.05) or are tending to differ () (p < 0.10) in relative abundances in “heavy” fractions compared to their respective “medium” fractions determined by one-way ANOVA.
Figure 5
Figure 5
Time profiles of absolute concentrations and relative 13C-enrichments of the 13C-labeled metabolites after addition of [U13C]glucose (40 mM) at different time points. (a) Lactate (blue), acetate (red), propionate (green), butyrate (purple), and (b) isobutyrate concentrations. Solid colours show the absolute concentration measured in the samples. Stripes highlight the relative enrichment of 13C (presented as atom percent excess, APE) in the metabolites after labeling with [U13C]glucose, with percentages indicated. Average of duplicates is shown. % = atom%-excess (APE).

Similar articles

Cited by

References

    1. Human Microbiome Project Consortium. Structure, function and diversity of the healthy human microbiome. Nature. 2012;486(7402):207–214. - PMC - PubMed
    1. Lozupone C. A., Stombaugh J. I., Gordon J. I., Jansson J. K., Knight R. Diversity, stability and resilience of the human gut microbiota. Nature. 2012;489(7415):220–230. doi: 10.1038/nature11550. - DOI - PMC - PubMed
    1. Bäckhed F., Ding H., Wang T., et al. The gut microbiota as an environmental factor that regulates fat storage. Proceedings of the National Academy of Sciences of the United States of America. 2004;101(44):15718–15723. doi: 10.1073/pnas.0407076101. - DOI - PMC - PubMed
    1. Clemente J. C., Ursell L. K., Parfrey L. W., Knight R. The impact of the gut microbiota on human health: an integrative view. Cell. 2012;148(6):1258–1270. doi: 10.1016/j.cell.2012.01.035. - DOI - PMC - PubMed
    1. Ivanov I. I., Littman D. R. Modulation of immune homeostasis by commensal bacteria. Current Opinion in Microbiology. 2011;14(1):106–114. doi: 10.1016/j.mib.2010.12.003. - DOI - PMC - PubMed

MeSH terms

LinkOut - more resources