

Socioeconomic status and treatment outcomes for individuals with HIV on antiretroviral treatment in the UK: cross-sectional and longitudinal analyses
- PMID: 28299369
- PMCID: PMC5341147
- DOI: 10.1016/S2468-2667(16)30002-0
Socioeconomic status and treatment outcomes for individuals with HIV on antiretroviral treatment in the UK: cross-sectional and longitudinal analyses
Abstract
Background: Few studies have assessed the effect of socioeconomic status on HIV treatment outcomes in settings with universal access to health care. Here we aimed to investigate the association of socioeconomic factors with antiretroviral therapy (ART) non-adherence, virological non-suppression, and virological rebound, in HIV-positive people on ART in the UK.
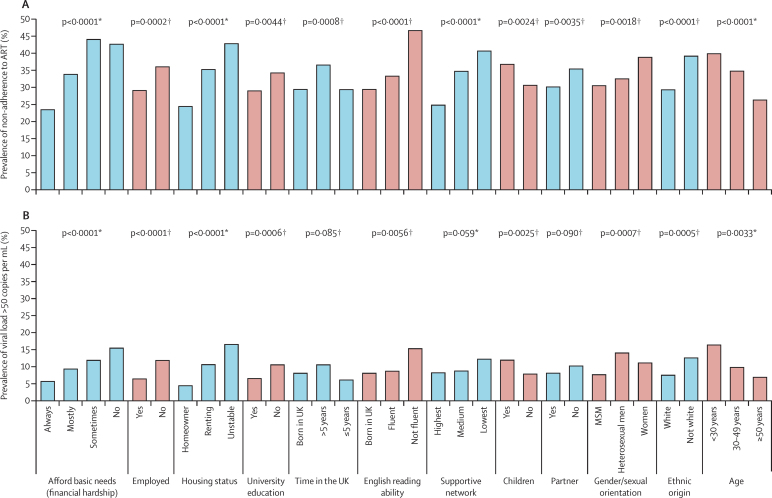
Methods: We used data from the Antiretrovirals, Sexual Transmission Risk and Attitudes (ASTRA) questionnaire study, which recruited participants aged 18 years or older with HIV from eight HIV outpatient clinics in the UK between Feb 1, 2011, and Dec 31, 2012. Participants self-completed a confidential questionnaire on sociodemographic, health, and lifestyle issues. In participants on ART, we assessed associations of financial hardship, employment, housing, and education with: self-reported ART non-adherence at the time of the questionnaire; virological non-suppression (viral load >50 copies per mL) at the time of questionnaire in those who started ART at least 6 months ago (cross-sectional analysis); and subsequent virological rebound (viral load >200 copies per mL) in those with initial viral load of 50 copies per mL or lower (longitudinal analysis).
Findings: Of the 3258 people who completed the questionnaire, 2771 (85%) reported being on ART at the time of the questionnaire, and 2704 with complete data were included. 873 (32%) of 2704 participants reported non-adherence to ART and 219 (9%) of 2405 had virological non-suppression in cross-sectional analysis. Each of the four measures of lower socioeconomic status was strongly associated with non-adherence to ART, and with virological non-suppression (prevalence ratios [PR] adjusted for gender/sexual orientation, age, and ethnic origin: greatest financial hardship vs none 2·4, 95% CI 1·6-3·4; non-employment 2·0, 1·5-2·6; unstable housing vs homeowner 3·0, 1·9-4·6; non-university education 1·6, 1·2-2·2). 139 (8%) of 1740 individuals had subsequent virological rebound (rate=3·6/100 person-years). Low socioeconomic status was predictive of longitudinal rebound risk (adjusted hazard ratio [HR] for greatest financial hardship vs none 2·3, 95% CI 1·4-3·9; non-employment 3·0, 2·1-4·2; unstable housing vs homeowner 3·3, 1·8-6·1; non-university education 1·6, 1·1-2·3).
Interpretation: Socioeconomic disadvantage was strongly associated with poorer HIV treatment outcomes in this setting with universal health care. Adherence interventions and increased social support for those most at risk should be considered.
Funding: National Institute for Health Research.
Figures

Similar articles
-
Alcohol, smoking, recreational drug use and association with virological outcomes among people living with HIV: cross-sectional and longitudinal analyses.HIV Med. 2022 Mar;23(3):209-226. doi: 10.1111/hiv.13156. Epub 2021 Oct 11. HIV Med. 2022. PMID: 34634176 Free PMC article.
-
Self-reported non-adherence to ART and virological outcome in a multiclinic UK study.AIDS Care. 2010 Aug;22(8):939-45. doi: 10.1080/09540121.2010.482126. AIDS Care. 2010. PMID: 20574863
-
Non-Disclosure of HIV Status and Associations with Psychological Factors, ART Non-Adherence, and Viral Load Non-Suppression Among People Living with HIV in the UK.AIDS Behav. 2017 Jan;21(1):184-195. doi: 10.1007/s10461-016-1541-4. AIDS Behav. 2017. PMID: 27586375 Free PMC article.
-
Socio-economic factors and virological suppression among people diagnosed with HIV in the United Kingdom: results from the ASTRA study.J Int AIDS Soc. 2014 Nov 2;17(4 Suppl 3):19533. doi: 10.7448/IAS.17.4.19533. eCollection 2014. J Int AIDS Soc. 2014. PMID: 25394042 Free PMC article.
-
Molecular biological assessment methods and understanding the course of the HIV infection.APMIS Suppl. 2003;(114):1-37. APMIS Suppl. 2003. PMID: 14626050 Review.
Cited by
-
Factors associated with antiretroviral therapy adherence among people living with HIV in Haiti: a cross-sectional study.AIDS Res Ther. 2021 Nov 2;18(1):81. doi: 10.1186/s12981-021-00405-4. AIDS Res Ther. 2021. PMID: 34727943 Free PMC article.
-
Cognitive performance in a South African cohort of people with HIV and comorbid major depressive disorder.J Neurovirol. 2022 Dec;28(4-6):537-551. doi: 10.1007/s13365-022-01093-0. Epub 2022 Sep 1. J Neurovirol. 2022. PMID: 36048403 Free PMC article.
-
Trends and Adaptive Optimal Set Points of CD4+ Count Clinical Covariates at Each Phase of the HIV Disease Progression.AIDS Res Treat. 2020 Mar 1;2020:1379676. doi: 10.1155/2020/1379676. eCollection 2020. AIDS Res Treat. 2020. PMID: 32190387 Free PMC article.
-
Respective roles of migration and social deprivation for virological non-suppression in HIV-infected adults on antiretroviral therapy in France.PLoS One. 2019 Mar 7;14(3):e0213019. doi: 10.1371/journal.pone.0213019. eCollection 2019. PLoS One. 2019. PMID: 30845270 Free PMC article.
-
The effect of socioeconomic disadvantage on strategies to end the AIDS epidemic.Lancet Public Health. 2016 Nov;1(1):e6-e7. doi: 10.1016/S2468-2667(16)30007-X. Epub 2016 Oct 12. Lancet Public Health. 2016. PMID: 28924622 Free PMC article. No abstract available.
References
-
- Hawkins NM, Jhund PS, McMurray JJ, Capewell S. Heart failure and socioeconomic status: accumulating evidence of inequality. Eur J Heart Fail. 2012;14:138–146. - PubMed
-
- Woods L, Rachet B, Coleman M. Origins of socioeconomic inequalities in cancer survival: a review. Ann Oncol. 2006;17:5–19. - PubMed
-
- Apter AJ, Reisine ST, Affleck G, Barrows E, ZuWallack RL. Adherence with twice-daily dosing of inhaled steroids: socioeconomic and health-belief differences. Am J Respir Crit Care Med. 1998;157:1810–1817. - PubMed
LinkOut - more resources
Full Text Sources
Other Literature Sources
Medical
Research Materials
