

GW-SEM: A Statistical Package to Conduct Genome-Wide Structural Equation Modeling
- PMID: 28299468
- PMCID: PMC5423544
- DOI: 10.1007/s10519-017-9842-6
GW-SEM: A Statistical Package to Conduct Genome-Wide Structural Equation Modeling
Abstract
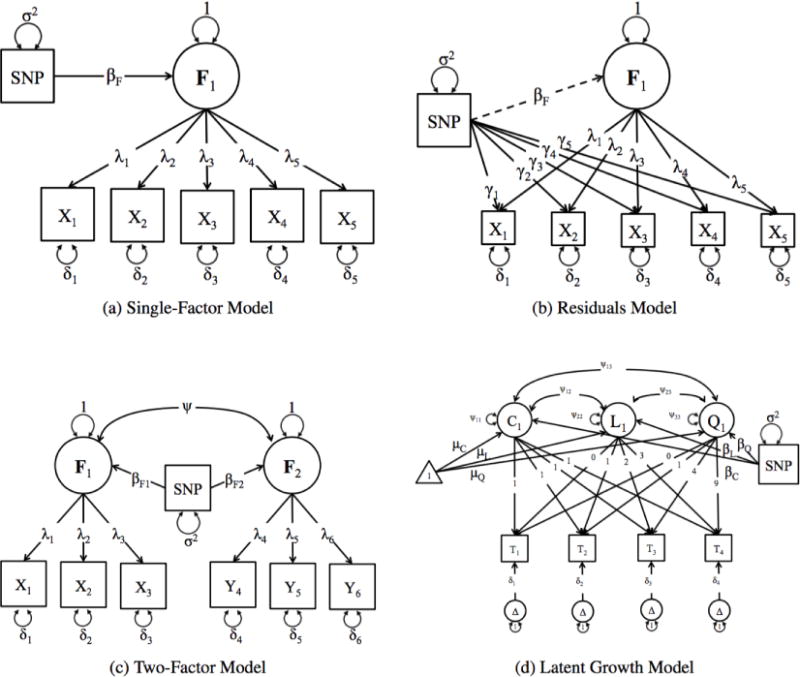
Improving the accuracy of phenotyping through the use of advanced psychometric tools will increase the power to find significant associations with genetic variants and expand the range of possible hypotheses that can be tested on a genome-wide scale. Multivariate methods, such as structural equation modeling (SEM), are valuable in the phenotypic analysis of psychiatric and substance use phenotypes, but these methods have not been integrated into standard genome-wide association analyses because fitting a SEM at each single nucleotide polymorphism (SNP) along the genome was hitherto considered to be too computationally demanding. By developing a method that can efficiently fit SEMs, it is possible to expand the set of models that can be tested. This is particularly necessary in psychiatric and behavioral genetics, where the statistical methods are often handicapped by phenotypes with large components of stochastic variance. Due to the enormous amount of data that genome-wide scans produce, the statistical methods used to analyze the data are relatively elementary and do not directly correspond with the rich theoretical development, and lack the potential to test more complex hypotheses about the measurement of, and interaction between, comorbid traits. In this paper, we present a method to test the association of a SNP with multiple phenotypes or a latent construct on a genome-wide basis using a diagonally weighted least squares (DWLS) estimator for four common SEMs: a one-factor model, a one-factor residuals model, a two-factor model, and a latent growth model. We demonstrate that the DWLS parameters and p-values strongly correspond with the more traditional full information maximum likelihood parameters and p-values. We also present the timing of simulations and power analyses and a comparison with and existing multivariate GWAS software package.
Keywords: DWLS; Diagonally weighted least squares; GWAS; Genetics; Genome-wide association study; SEM; Structural equation modeling.
Conflict of interest statement
Figures
References
-
- Abecasis GR, Cherny SS, Cookson WO, Cardon LR. Merlinrapid analysis of dense genetic maps using sparse gene flow trees. Nat Genet. 2002 Jan;30(1):97–101. - PubMed
-
- Agresti A. Categorical data analysis. second. Wiley-Interscience; 2002.
-
- Bock RD, Aitkin M. Marginal maximum likelihood estimation of item parameters: Application of an EM algorithm. Psychometrika. 1981;46(4):443459.
-
- Boker SM, Neale MC, Maes HH, Wilde MJ, Spiegel M, Brick TR, Driver C. Openmx 2.3.1 user guide [Computer software manual] 2015.
Publication types
MeSH terms
Grants and funding
LinkOut - more resources
Full Text Sources
Other Literature Sources
Molecular Biology Databases
