

Have the Causes of Revision for Total and Unicompartmental Knee Arthroplasties Changed During the Past Two Decades?
- PMID: 28299718
- PMCID: PMC5449334
- DOI: 10.1007/s11999-017-5316-7
Have the Causes of Revision for Total and Unicompartmental Knee Arthroplasties Changed During the Past Two Decades?
Abstract
Background: Revisions after knee arthroplasty are expected to increase, and the epidemiology of failure mechanisms is changing as new implants, technology, and surgical techniques evolve.
Questions/purposes: (1) Was there improvement in survival for TKA and unicompartmental knee arthroplasty (UKA) when comparing two consecutive 11-year periods with similar followups in a national registry? (2) Were there changes in the causes of revision during the two times? (3) Could the changes in revision causes be attributed to patient or implant characteristics?
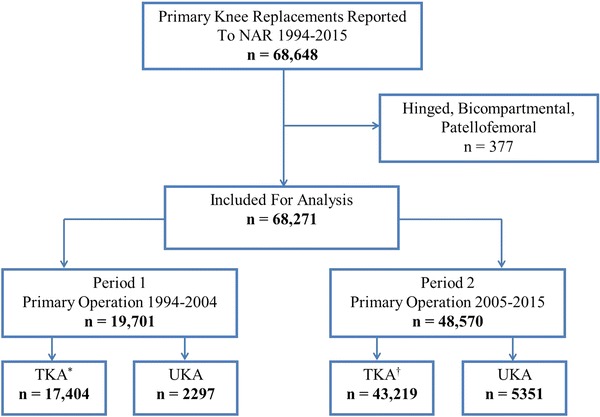
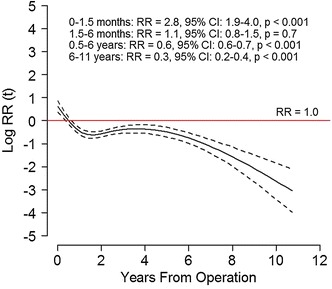
Methods: A total of 60,623 TKAs (2426 revisions) and 7648 UKAs (725 revisions) were selected from the Norwegian Arthroplasty Register and analyzed based on year of primary surgery: 1994 to 2004 (Period 1) and 2005 to 2015 (Period 2). TKAs had median followup of 3.5 years in Period 1 and 4.2 years in Period 2. Median followup for UKAs was 2.7 years in Period 1 and 4.6 years in Period 2. Of the patients included in the registry, 99.6% were accounted for at the time of analysis, whereas 0.4% had moved abroad. We used Kaplan-Meier analyses and log-rank test to investigate changes in survival. Relative risk of revision in Period 2 relative to Period 1 was calculated for each registered revision cause in a Cox regression model adjusted for age, sex, diagnosis, fixation, and patella resurfacing.
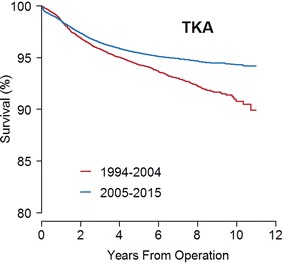
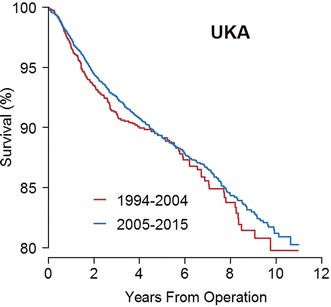
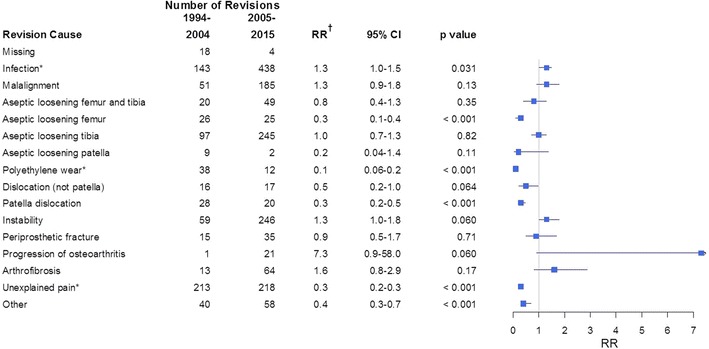
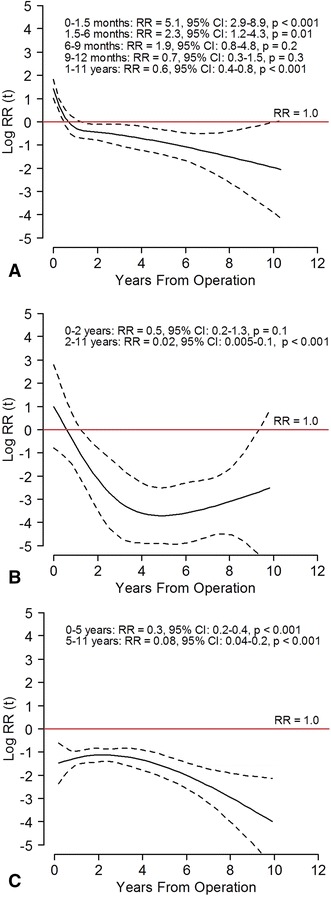
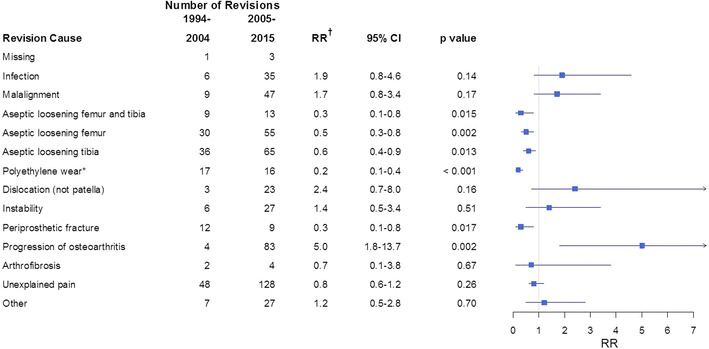
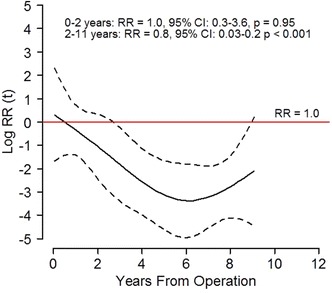
Results: For TKAs, the 10-year Kaplan-Meier survival free from revision improved from Period 1 to Period 2 from 91% (95% CI, 90%-92%) to 94% (95% CI, 94%-95%; p < 0.001). Revisions resulting from aseptic loosening of the femoral component, polyethylene wear/breakage, patellar dislocation, and unexplained pain decreased, whereas revisions resulting from early infection increased. Patients in Period 2 were younger and more often men compared with patients in Period 1. A higher risk of revision was found for male sex (relative risk [RR], 1.1; 95% CI, 1.0-1.2; p = 0.048) and age younger than 65 years (RR, 1.7; 95% CI, 1.6-1.9; p < 0.001). With UKAs, the 10-year survival free from revision was 80% (95% CI, 76%-84%) in Period 1 and 81% (95% CI, 79%-83%; p = 0.261) in Period 2. Revisions resulting from tibial aseptic loosening, polyethylene wear/breakage, and periprosthetic fractures decreased, but there were more revisions resulting from progression of osteoarthritis. In Period 2, there were more men and the average age was younger than for patients in Period 1. For UKAs, age younger than 65 years had a higher risk of revision (RR, 1.7; 95% CI, 1.5-2.0; p < 0.001), whereas sex did not affect the risk of revision.
Conclusions: We found an improvement in survival free from revision for TKA in the last period, but no similar improvement for UKA, and the survivorship for UKAs remains rather dramatically lower than that observed for TKAs. The decision to perform a UKA should be made with the explicit awareness that its survivorship is substantially inferior to that of TKA; any perceived advantages of UKA should be balanced against this issue of its decreased durability.
Level of evidence: Level III, therapeutic study.
Figures
Comment in
-
CORR Insights®: Have the Causes of Revision for Total and Unicompartmental Knee Arthroplasties Changed During the Past Two Decades?Clin Orthop Relat Res. 2017 Jul;475(7):1887-1890. doi: 10.1007/s11999-017-5335-4. Epub 2017 Mar 30. Clin Orthop Relat Res. 2017. PMID: 28361283 Free PMC article. No abstract available.
References
-
- AOA Australian Orthopaedic Association National Joint Replacement Registry. Annual Report 2015: Hip and Knee Arthroplasty. Available at: https://aoanjrr.sahmri.com/en/annual-reports-2015. Accessed February 27, 2017.
-
- Arthursson AJ, Furnes O, Espehaug B, Havelin LI, Söreide JA. Validation of data in the Norwegian Arthroplasty Register and the Norwegian Patient Register: 5,134 primary total hip arthroplasties and revisions operated at a single hospital between 1987 and 2003. Acta Orthop. 2005;76:823–828. doi: 10.1080/17453670510045435. - DOI - PubMed
-
- Aunan E, Naess G, Clarke-Jenssen J, Sandvik L, Kibsgard TJ. Patellar resurfacing in total knee arthroplasty: functional outcome differs with different outcome scores: a randomized, double-blind study of 129 knees with 3 years of follow-up. Acta Orthop. 2016;87:158–164. doi: 10.3109/17453674.2015.1111075. - DOI - PMC - PubMed
MeSH terms
LinkOut - more resources
Full Text Sources
Other Literature Sources
Medical
Miscellaneous
