. 2018 Apr;8(2):342-356.
doi: 10.1007/s13346-017-0366-7.

A versatile method for the preparation of particle-loaded microbubbles for multimodality imaging and targeted drug delivery

Affiliations

A versatile method for the preparation of particle-loaded microbubbles for multimodality imaging and targeted drug delivery

Joshua Owen et al. Drug Deliv Transl Res. 2018 Apr.

Abstract

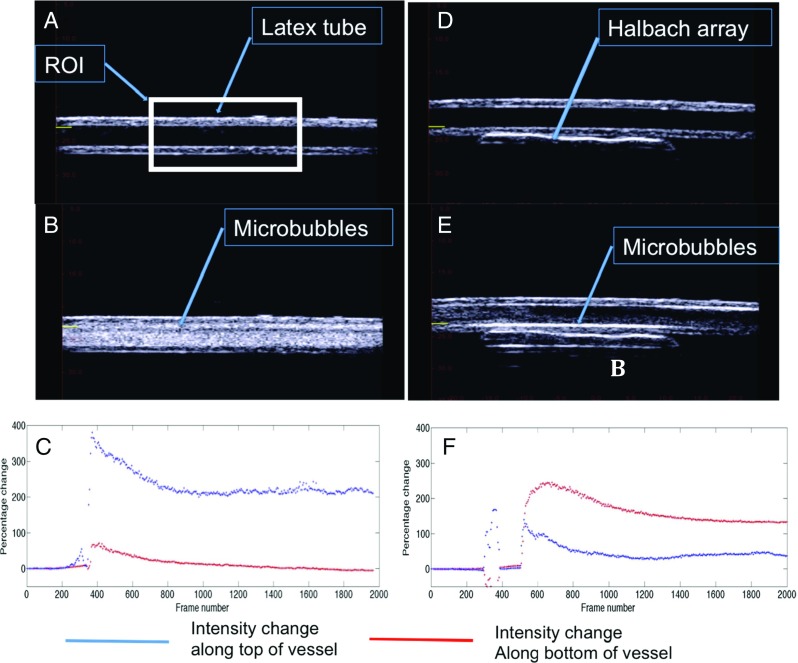
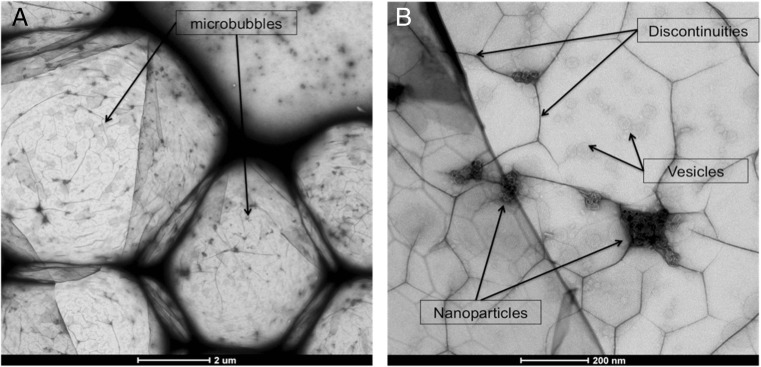
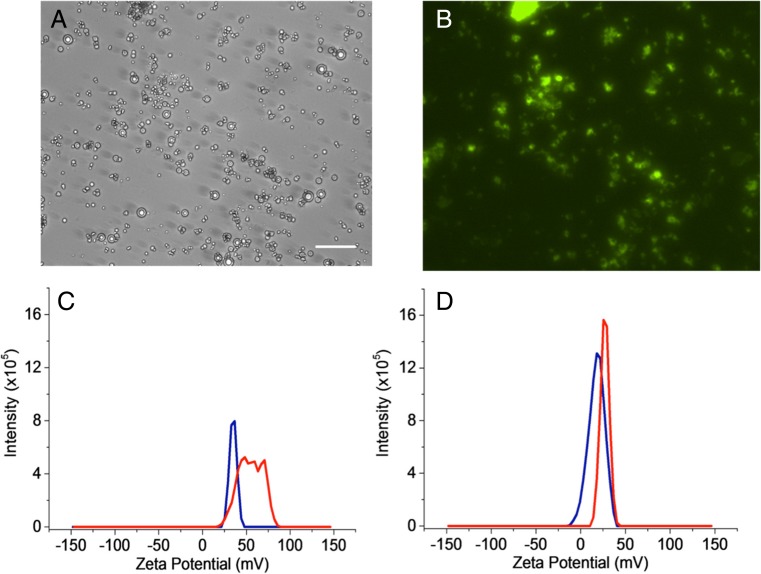
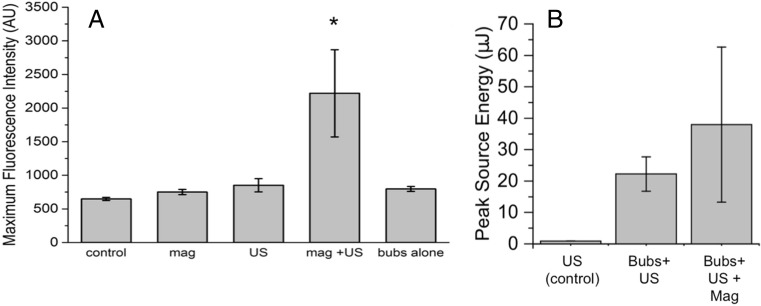
Microbubbles are currently in clinical use as ultrasound contrast agents and under active investigation as mediators of ultrasound therapy. To improve the theranostic potential of microbubbles, nanoparticles can be attached to the bubble shell for imaging, targeting and/or enhancement of acoustic response. Existing methods for fabricating particle-loaded bubbles, however, require the use of polymers, oil layers or chemical reactions for particle incorporation; embed/attach the particles that can reduce echogenicity; impair biocompatibility; and/or involve multiple processing steps. Here, we describe a simple method to embed nanoparticles in a phospholipid-coated microbubble formulation that overcomes these limitations. Magnetic nanoparticles are used to demonstrate the method with a range of different microbubble formulations. The size distribution and yield of microbubbles are shown to be unaffected by the addition of the particles. We further show that the microbubbles can be retained against flow using a permanent magnet, can be visualised by both ultrasound and magnetic resonance imaging (MRI) and can be used to transfect SH-SY5Y cells with fluorescent small interfering RNA under the application of a magnetic field and ultrasound field.

Keywords: Contrast agents; Drug delivery; Magnetic; Microbubbles; Targeting; Ultrasound.


Conflict of interest statement

The authors declare that they have no conflict of interest.

Figures

Fig. 1
Fig. 1
Setup for cell transfection experiments (not to scale). A cross-sectional view through the water tank is shown. Samples were placed in a cell chamber at the focus of a 500-kHz focused ultrasound transducer with a rectangular cutout for an imaging array. The imaging array was used for B-mode imaging for alignment of the sample at the focus and to passively record acoustic emissions during ultrasound exposure. The transducer was driven by a function generator via a power amplifier and impedance matching network. A second function generator set to generate a pulse train was used to allow treatment to take place at a multiple of the imaging frame rate. The black arrow points to an OptiCell™ in the z-direction, showing the six sites on the cell culture plate that were exposed to the conditions outlined below
Fig. 2
Fig. 2
Proposed mechanism of magnetic microbubble formation. A A solution with lipid vesicles of varying sizes and lipid-coated nanoparticles is heated above the phase transition temperature. B During sonication at the gas–water interface, gas is entrained forming bubbles and the lipid vesicles break up into fragments which adsorb onto the bubbles with the nanoparticles. C After cooling, the phospholipid shell condenses with nanoparticles entrapped within it
Fig. 3
Fig. 3
Comparison of microbubble stability with and without iron oxide nanoparticles. Normalised mean diameter and concentration data were calculated for each time point by dividing the measurement result with the initial measurement result at the start of the stability study. a Change in mean diameter with time at 23 and 37 °C. b Change in concentration with time at 23 and 37 °C. Error bars indicate the standard deviation (n = 3)
Fig. 4
Fig. 4
Example of a microscope image of a microbubbles (medium chain) and b magnetic microbubbles (at ×40 magnification, scale bar 50 μm for both images). c Size distribution of magnetic microbubbles showing the majority of microbubbles are within the clinically relevant size range <8 μm. A vial of magnetic microbubbles d before and e after application of a magnetic field is also shown, with noticeable accumulation of microbubbles in proximity to the magnet
Fig. 5
Fig. 5
Acoustic images of targeting of magnetic microbubbles. a Latex tube with water flowing through. b After injection of magnetic microbubbles. c Intensity analysis in the region of interest (ROI) along the bottom wall (red) of the vessel and the top wall (blue) indicates the highest signal intensity was detected at the top of the tube over the course of the ultrasound. d The same latex tube with a magnetic Halbach array positioned underneath with water flowing through. e After injection of magnetic microbubbles, an increase in signal intensity is observed along the bottom of the tube. f Intensity analysis within the same ROI along the top (blue) and bottom (red) walls of the tube indicates that the highest intensity occurred at the bottom of the tube at the wall closest to the magnetic Halbach array
Fig. 6
Fig. 6
Magnetic relaxivity of magnetic microbubble formulation created with lipid-coated magnetic nanoparticles for three different concentrations of microbubbles
Fig. 7
Fig. 7
Transmission electron microscopy images of DSPC/PEG-40 stearate (9:1 M ratio) microbubbles created with lipid-coated nanoparticles. a The whole structure and size of magnetic microbubbles. b Increased magnification of the microbubble shell
Fig. 8
Fig. 8
Microscopy images of magnetic microbubbles bound to siRNA after centrifugation in a bright field and b fluorescence (10-s exposure, gain 1) using a ×20 objective. Scale bar is 50 μm. c Zeta potential of charged microbubble precursors before (red) and after (blue) the addition of siRNA. d Zeta potential of magnetically charged microbubble precursors before (red) and after (blue) the addition of siRNA
Fig. 9
Fig. 9
a Bar chart of the average maximum fluorescence intensity from all microscope images of cells obtained. Control is cells without exposure to siRNA, and all other results are after exposure to microbubbles with siRNA with the conditions listed underneath. Error bars indicate standard deviation (n = 6, except for mag where n = 3; *p < 0.01, with all other groups). b Summary of PAM data. The mean and standard deviation of the peak value in each map over the six treatment locations are shown. US ultrasound, mag magnetic field, bubs magnetic microbubbles

References

    1. Calliada F, Campani R, Bottinelli O, Bozzini A, Sommaruga MG. Ultrasound contrast agents: basic principles. Eur J Radiol. 1998;27:S157–SS60. doi: 10.1016/S0720-048X(98)00057-6. - DOI - PubMed
    1. Quaia E. Contrast media in ultrasonography. 2005. - PubMed
    1. Stride E, Edirisinghe M. Novel microbubble preparation technologies. Soft Matter. 2008;4:2350. doi: 10.1039/b809517p. - DOI
    1. Shapiro MG, Goodwill PW, Neogy A, Yin M, Foster FS, Schaffer DV, et al. Biogenic gas nanostructures as ultrasonic molecular reporters. Nat Nanotechnol. 2014;9:311–316. doi: 10.1038/nnano.2014.32. - DOI - PMC - PubMed
    1. Wheatley MA, Schrope B, Shen P. Contrast agents for diagnostic ultrasound: development and evaluation of polymer-coated microbubbles. Biomaterials. 1990;11:713–717. doi: 10.1016/0142-9612(90)90033-M. - DOI - PubMed

Publication types

MeSH terms

LinkOut - more resources