

Targeted High Performance Liquid Chromatography Tandem Mass Spectrometry-based Metabolomics differentiates metabolic syndrome from obesity
- PMID: 28299975
- PMCID: PMC5363695
- DOI: 10.1177/1535370217694098
Targeted High Performance Liquid Chromatography Tandem Mass Spectrometry-based Metabolomics differentiates metabolic syndrome from obesity
Abstract
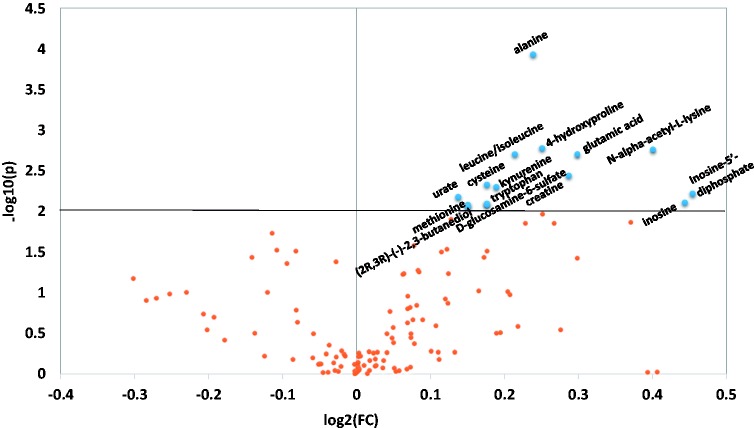
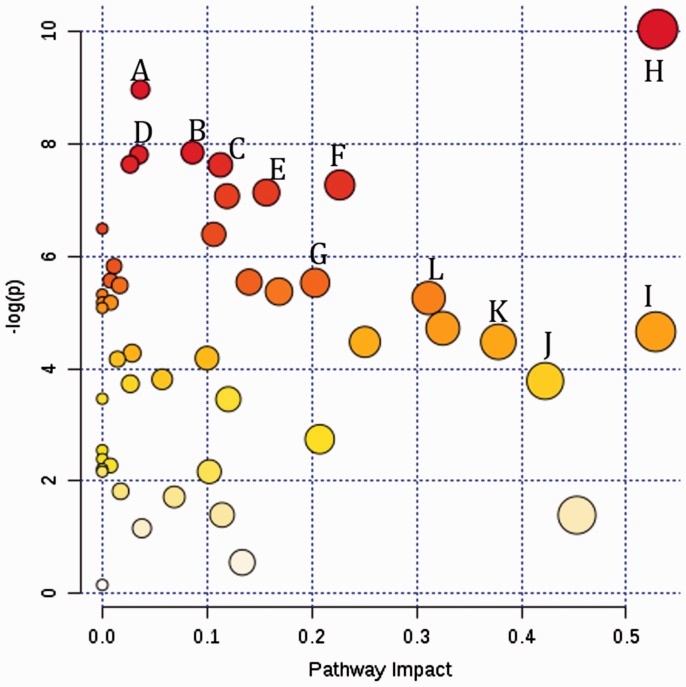
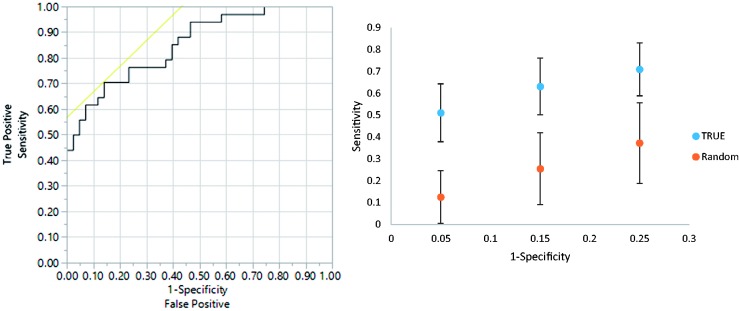
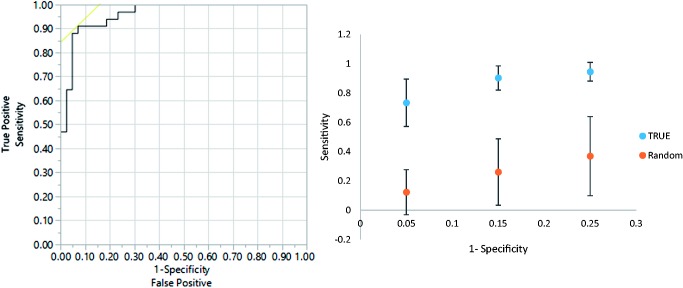
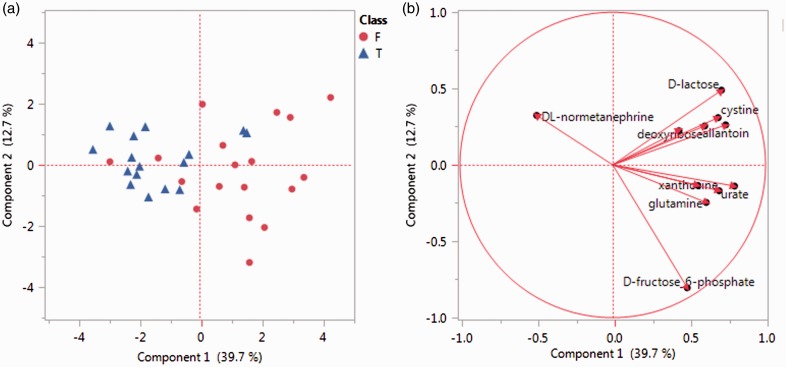
Both obesity and the metabolic syndrome are risk factors for type 2 diabetes and cardiovascular disease. Identification of novel biomarkers are needed to distinguish metabolic syndrome from equally obese individuals in order to direct them to early interventions that reduce their risk of developing further health problems. We utilized mass spectrometry-based targeted metabolic profiling of 221 metabolites to evaluate the associations between metabolite profiles and established metabolic syndrome criteria (i.e. elevated waist circumference, hypertension, elevated fasting glucose, elevated triglycerides, and low high-density lipoprotein cholesterol) in plasma samples from obese men ( n = 29; BMI = 35.5 ± 5.2 kg/m2) and women ( n = 40; 34.9 ± 6.7 kg/m2), of which 26 met the criteria for metabolic syndrome (17 men and 9 women). Compared to obese individuals without metabolic syndrome, univariate statistical analysis and partial least squares discriminant analysis showed that a specific group of metabolites from multiple metabolic pathways (i.e. purine metabolism, valine, leucine and isoleucine degradation, and tryptophan metabolism) were associated with the presence of metabolic syndrome. Receiver operating characteristic curves generated based on the PLS-DA models showed excellent areas under the curve (0.85 and 0.96, for metabolites only model and enhanced metabolites model, respectively), high specificities (0.86 and 0.93), and good sensitivities (0.71 and 0.91). Moreover, principal component analysis revealed that metabolic profiles can be used to further differentiate metabolic syndrome with 3 versus 4-5 metabolic syndrome criteria. Collectively, these findings support targeted metabolomics approaches to distinguish metabolic syndrome from obesity alone, and to stratify metabolic syndrome status based on the number of criteria met. Impact statement We utilized mass spectrometry-based targeted metabolic profiling of 221 metabolites to evaluate the associations between metabolite profiles and established MetS criteria. To our best knowledge, the findings of this study provide the first evidence that metabolic profiles can be used to differentiate participants with MetS from similarly obese individuals who do not meet established criteria of MetS. Furthermore, the study demonstrated that within MetS participants, their unique metabolic profiles correlated to the number of criteria used for MetS determination. Taken together, this metabolic profiling approach can potentially serve as a novel tool for MetS detection and monitoring, and provide useful metabolic information for future interventions targeting obesity and MetS.
Keywords: HPLC-MS/MS; metabolic pathways; metabolic syndrome; obesity; targeted metabolic profiling.
Figures
References
-
- Vidal-Puig A. The Metabolic Syndrome and its Complex Pathophysiology. In: Orešič M, Vidal-Puig A. (eds). A systems biology approach to study metabolic syndrome, Cham: Springer International Publishing, 2014, pp. 3–16.
-
- Aguilar M, Bhuket T, Torres S, Liu B, Wong RJ. PRevalence of the metabolic syndrome in the United States, 2003–2012. JAMA 2015; 313: 1973–4. - PubMed
-
- Alberti KGMM, Eckel RH, Grundy SM, Zimmet PZ, Cleeman JI, Donato KA, Fruchart J-C, James WPT, Loria CM, Smith SC. Harmonizing the metabolic syndrome. A Joint Interim Statement of the International Diabetes Federation Task Force on Epidemiology and Prevention; National Heart, Lung, and Blood Institute; American Heart Association; World Heart Federation; International Atherosclerosis Society; and International Association for the Study of Obesity. Circulation 2009;120:1640–5. - PubMed
-
- Paredes RM, Quinones M, Marballi K, Gao X, Valdez C, Ahuja SS, Velligan D, Walss-Bass C. Metabolomic profiling of schizophrenia patients at risk for metabolic syndrome. Int J Neuropsychopharmacol 2014; 17: 1139–48. - PubMed
Publication types
MeSH terms
Substances
LinkOut - more resources
Full Text Sources
Other Literature Sources
Medical
Miscellaneous