. 2017 Mar 16:8:14799.
doi: 10.1038/ncomms14799.

H3 ubiquitination by NEDD4 regulates H3 acetylation and tumorigenesis

Affiliations

H3 ubiquitination by NEDD4 regulates H3 acetylation and tumorigenesis

Xian Zhang et al. Nat Commun. .

Abstract

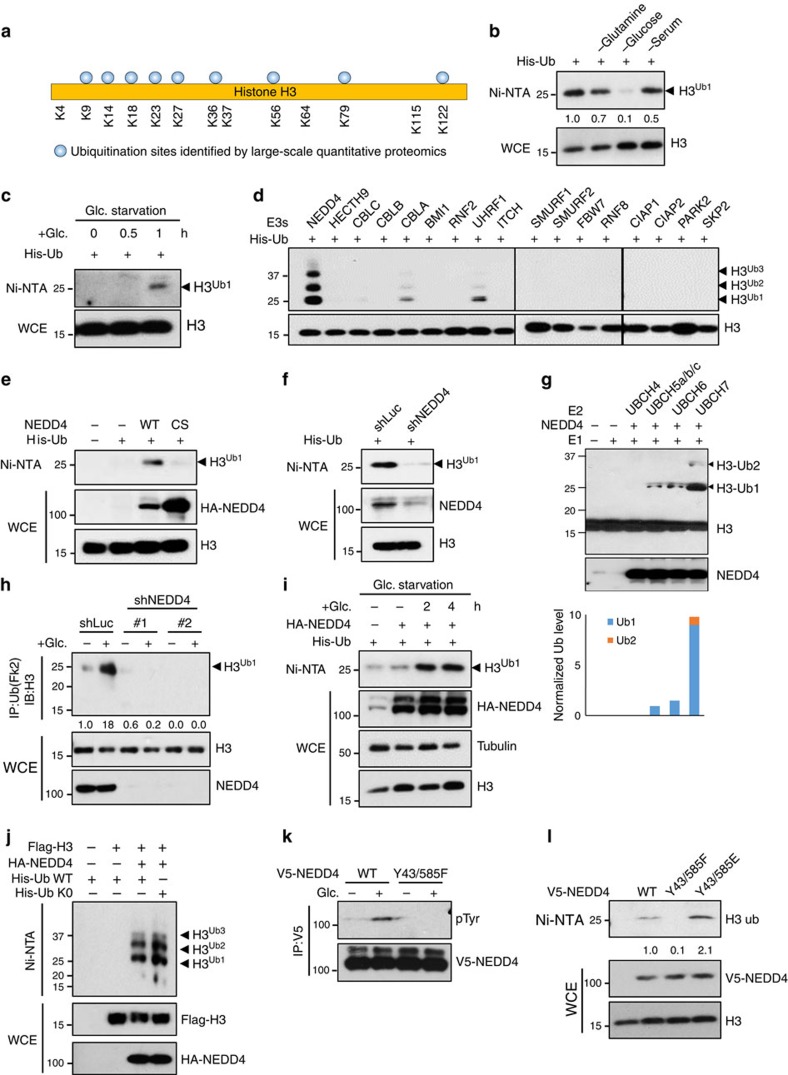
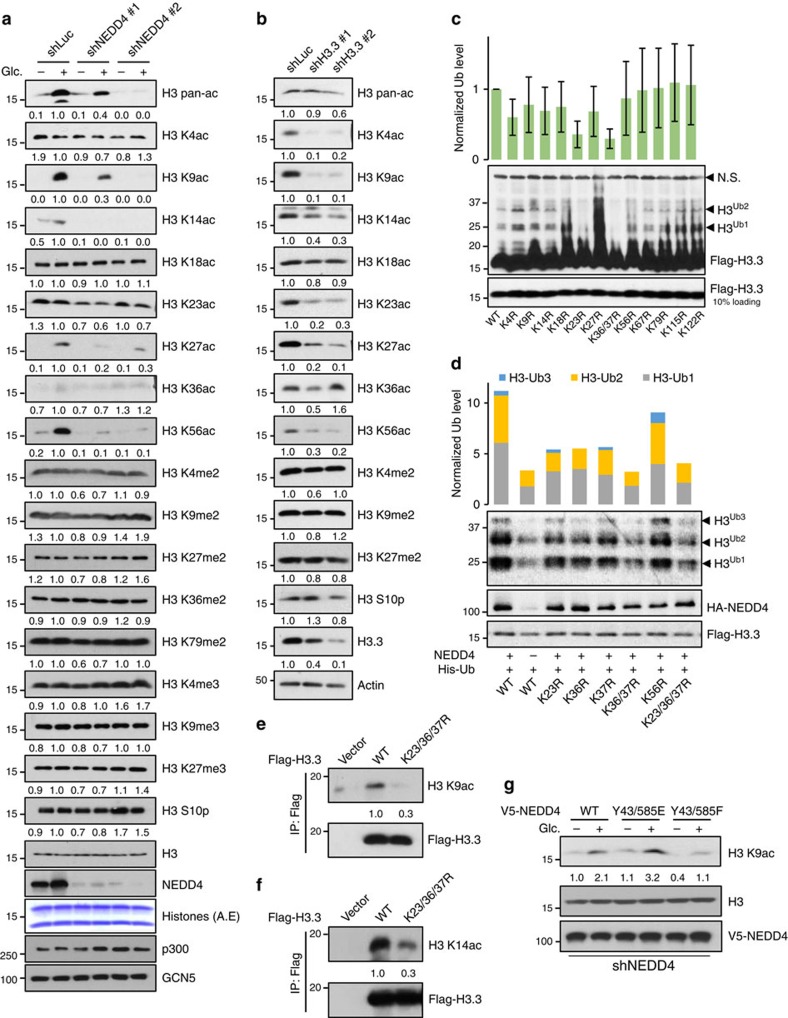
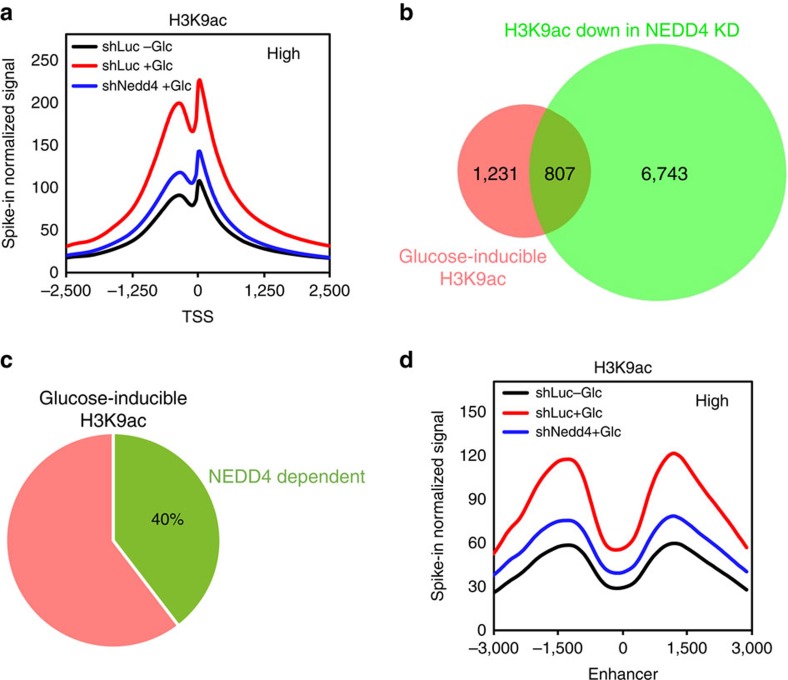
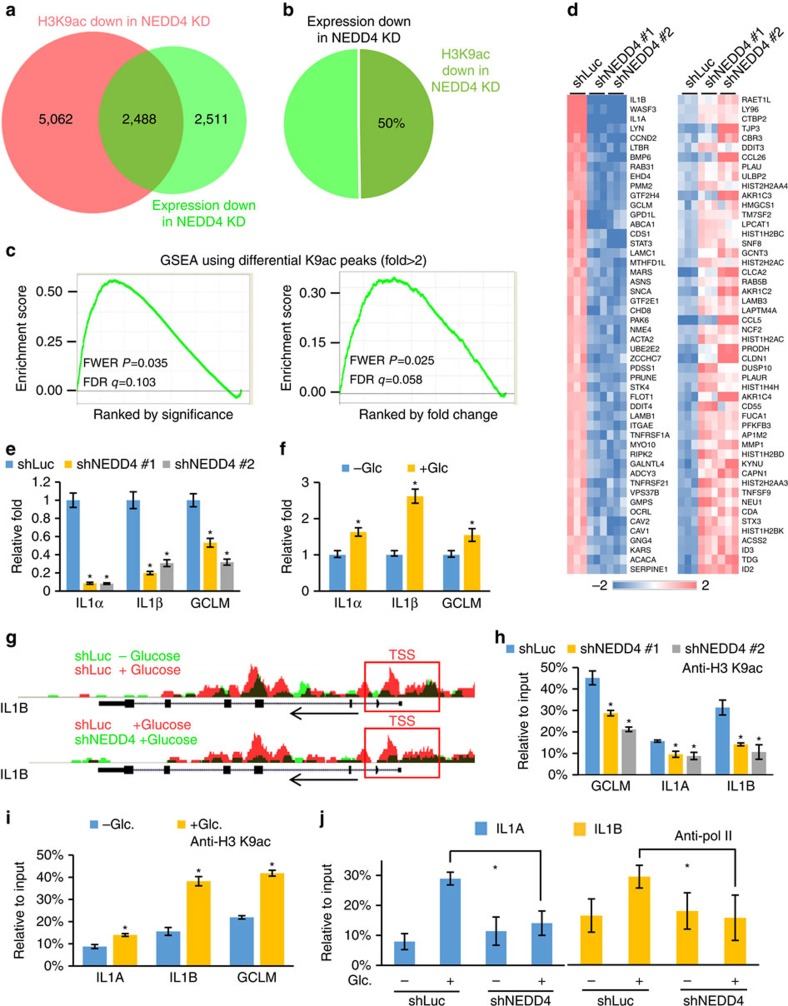
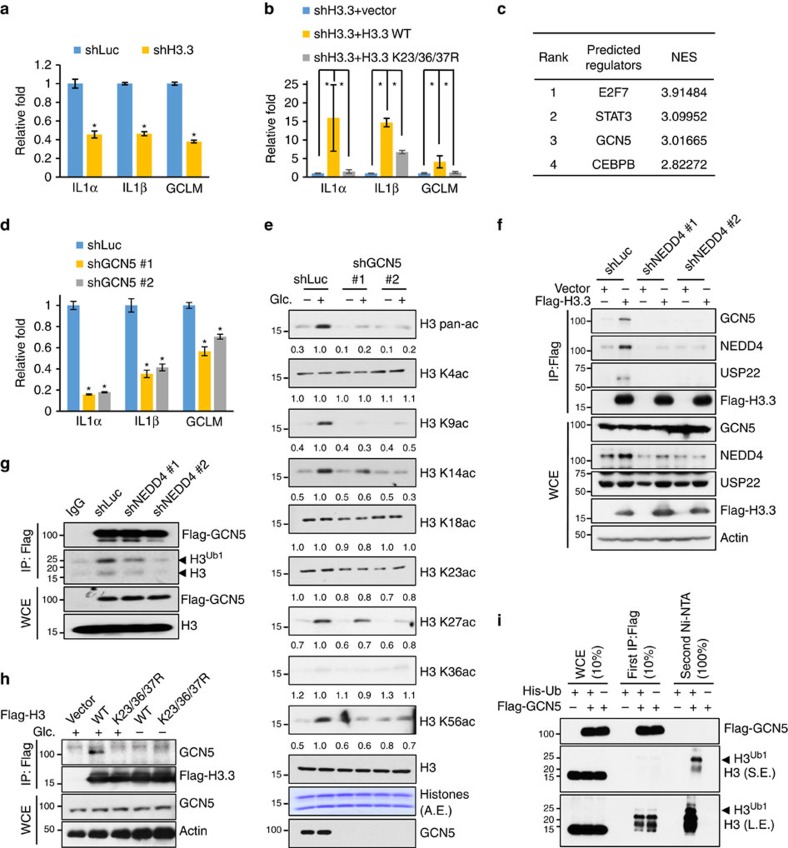
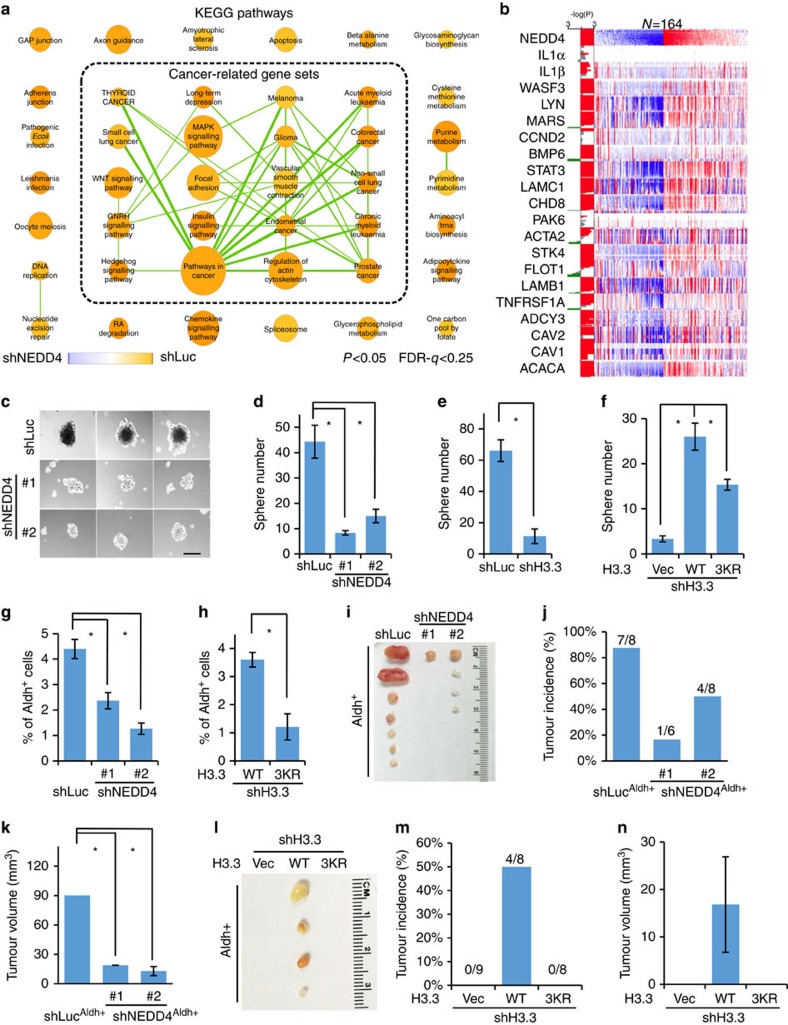
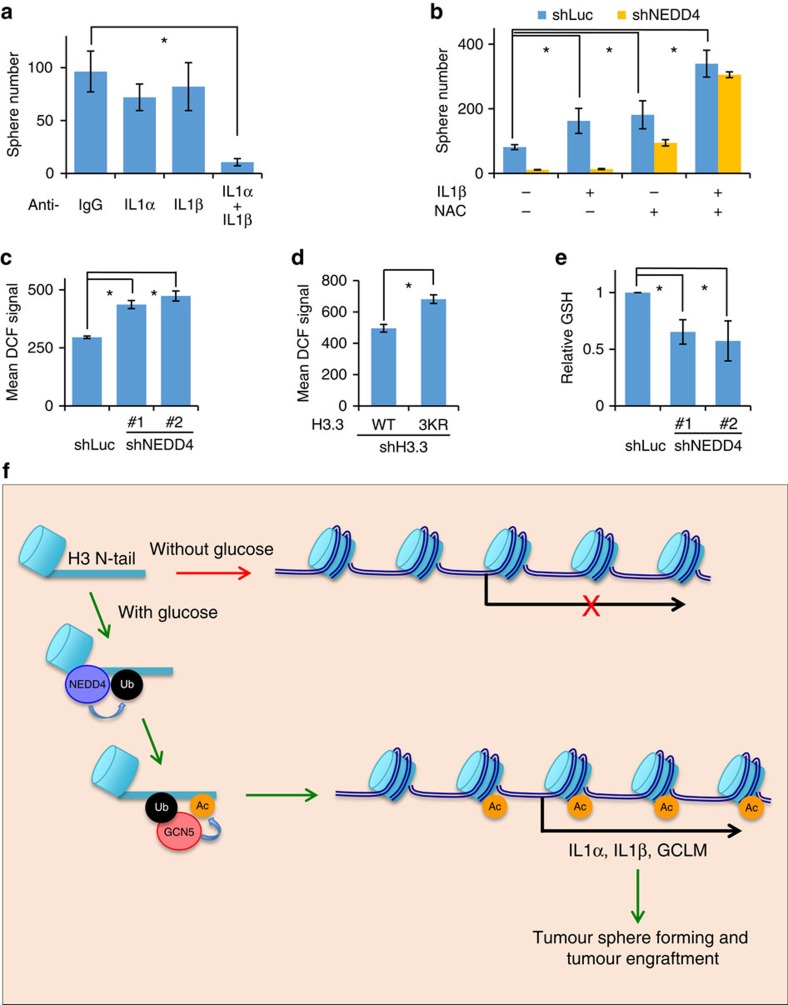
Dynamic changes in histone modifications under various physiological cues play important roles in gene transcription and cancer. Identification of new histone marks critical for cancer development is of particular importance. Here we show that, in a glucose-dependent manner, E3 ubiquitin ligase NEDD4 ubiquitinates histone H3 on lysine 23/36/37 residues, which specifically recruits histone acetyltransferase GCN5 for subsequent H3 acetylation. Genome-wide analysis of chromatin immunoprecipitation followed by sequencing reveals that NEDD4 regulates glucose-induced H3 K9 acetylation at transcription starting site and enhancer regions. Integrative analysis of ChIP-seq and microarray data sets also reveals a consistent role of NEDD4 in transcription activation and H3 K9 acetylation in response to glucose. Functionally, we show that NEDD4-mediated H3 ubiquitination, by transcriptionally activating IL1α, IL1β and GCLM, is important for tumour sphere formation. Together, our study reveals the mechanism for glucose-induced transcriptome reprograming and epigenetic regulation in cancer by inducing NEDD4-dependent H3 ubiquitination.


Conflict of interest statement

The authors declare no competing financial interests.

Figures

Figure 1
Figure 1. NEDD4 ubiquitinates H3 upon glucose stimulation.
(a) Summary of H3 ubiquitination sites identified in various large-scale quantitative proteomics studies. (b) Glucose deprivation abolished H3 ubiquitination. 293T cells were transfected with his-ubiquitin plasmid (His-Ub) for 36 h and treated with various stresses for 4 h before in vivo ubiquitination assay to access the H3 ubiquitination (see experimental procedures for details). (c) Add-back of glucose recovered H3 ubiquitination. 293T cells were transfected with his-ubiquitin plasmid for 36 h, then glucose-starved for 4 h and added-back glucose for indicated times (see experimental procedures for detail) before in vivo ubiquitination assay. (d) Screening of E3 ligases for H3 ubiquitination. 293T cells were transfected with his-ubiquitin plasmid and various E3 ligases constructs for in vivo ubiquitination assay. (e) NEDD4 E3 ligase dead mutant (CS mutant) failed to trigger H3 ubiquitination. 293T cells were transfected with his-ubiquitin plasmid and WT NEDD4 or NEDD4 CS mutant construct for in vivo ubiquitination assay. (f) NEDD4 knockdown abolished H3 ubiquitination. Control and NEDD4 knockdown 293T cells were transfected with his-ubiquitin plasmid for in vivo ubiquitination assay. (g) NEDD4 ubiquitinated H3 in vitro. In vitro ubiquitination assay was performed for recombinant NEDD4 and histone octamer (see experimental procedures for details). Reaction products were then assessed by western blotting using anti H3 antibody. H3 mono- and di-ubiquitination have predicted molecular weights of ∼25 kDa and ∼33 kDa. S.E. and L.E. are abbreviations for shorter exposure time and longer exposure time, respectively. (h) NEDD4 knockdown abolished glucose-induced H3 ubiquitination. Hep3B cells were glucose starved for 4 h and added-back glucose for 2 h before immunoprecipitation assay for endogenous ubiquitinated proteins (see experimental procedures for details). H3 ubiquitination was then visualized by western blotting. (i) Add-back of glucose recovered NEDD4 overexpression induced H3 ubiquitination. 293T cells were transfected with his-ubiquitin and NEDD4 plasmids for 36 h, then glucose-starved for 4 h and added-back glucose for indicated times before in vivo ubiquitination assay. (j) NEDD4 triggered monoubiquitination on H3. 293T cells were transfected with Flag-H3, HA-NEDD4, His-Ub WT and His-Ub K0 as indicated before in vivo ubiquitination assay. (k) Glucose-induced NEDD4 phosphorylation at Y43 and Y585. 293T cells transfected with WT or Y43/585F NEDD4 plasmids were treated with glucose and harvested for IP. (l) NEDD4 phosphorylation is required for H3 ubiquitination. 293T cells transfected with WT, Y43585F or Y43/585E NEDD4 plasmids were harvested for in vivo ubiquitination assay.
Figure 2
Figure 2. Glucose-induced H3 ubiquitination by NEDD4 is required for H3 K9/K14 acetylation.
(a) NEDD4 knockdown abolished glucose-induced H3 K9, K14, K27 and K56 acetylation. Control and NEDD4 knockdown Hep3B cells were glucose starved for 4 h and added-back glucose for 3 h before whole-cell extraction for western blot analysis (see experimental procedures for details). A.E., acid extraction. (b) H3.3 knockdown abolished H3 K9, K14, K27 and K56 acetylation. Control and H3.3 knockdown Hep3B cells were lysed for western blot analysis. (c) H3 K23R and K36/37R mutant abolished glucose-induced H3 ubiquitination. Hep3B cells expressing various Flag-H3.3 constructs were glucose-starved for 4 h and added-back glucose for 2 h before chromatin fractionation assay. Ubiquitination levels were normalized to input (n=5, mean±s.e.m.). NS, nonspecific band. (d) H3 K23 and K36/37R mutant abolished NEDD4 overexpression induced H3 ubiquitination. 293T cells were transfected with his-ubiquitin, NEDD4 plasmids and various Flag-H3.3 constructs for 36 h before in vivo ubiquitination assay. Ubiquitination levels were normalized to input. (e,f) H3 K23/36/37R is defect in H3 K9/K14 acetylation. WT or K23/36/37R Flag-H3.3 was stably expressed in Hep3B cells and immunoprecipitated for western blot analysis. (g) NEDD4 knockdown Hep3B cells transfected with WT, Y43/585E or Y43/585F mutant were treated with glucose and harvested for western blot analysis.
Figure 3
Figure 3. NEDD4 is required for glucose-induced H3 K9 acetylation at TSS and enhancers.
NEDD4 knockdown impaired glucose-induced genome-wide H3 K9 acetylation at TSS and enhancer regions. ChIP-seq was performed for control and NEDD4 knockdown Hep3B cells before or after adding-back of glucose for 3 h. Shown were global H3 K9ac profiles at TSS (a), Venn diagram of genes with differential H3 K9ac peaks at TSS under glucose treatment and NEDD4 knockdown condition (b,c), and global H3 K9ac profiles at known enhancers (d). See experimental procedures for details.
Figure 4
Figure 4. H3 ubiquitination regulates transcription and recruits GCN5 for H3 acetylation.
(ac) NEDD4 regulates H3 K9ac at TSS of NEDD4 target genes. Shown were Venn diagram of genes with differential expression or differential H3 K9ac at TSS. GSEA was performed to evaluate the distribution of genes that show down-regulation of H3K9ac at TSS in NEDD4 knockdown cells in microarray-derived gene list, which is rank ordered either by T-test or fold change. (d) Heat map view of top and bottom gene list of microarray data sets. Microarray analysis for total RNA was performed for control and NEDD4 knockdown Hep3B cells. (e) NEDD4 knockdown impaired IL1α, IL1β and GCLM expression. qPCR was performed to analyse the mRNA level in control and NEDD4 knockdown Hep3B cells (n=3, mean±s.e.m.). (f) IL1α, IL1β and GCLM were induced by glucose. Hep3B cells were glucose starved for 4 h and added-back glucose for 6 h before qPCR analysis (n=3, mean±s.e.m.). (g) UCSC genome browser view of ChIP-seq H3 K9ac signals along the IL1B gene. (h) NEDD4 knockdown impaired H3 K9ac at TSS of IL1α IL1β and GCLM genes. ChIP-qPCR using anti-H3 K9ac antibody was performed for control and NEDD4 knockdown Hep3B cells (n=3, mean±s.e.m.). (i) H3 K9ac was induced at TSS of IL1 α IL1β and GCLM genes by glucose. Hep3B cells were glucose-starved for 4 h and added-back glucose for 6 h before ChIP-qPCR analysis using anti-H3 K9ac antibody (n=3, mean±s.e.m.). (j) NEDD4 knockdown impaired glucose-induced polymerase II (pol II) binding at TSS of IL1A and IL1B genes. Control and NEDD4 knockdown Hep3B cells were glucose-starved for 4 h and added-back glucose for 6 h before ChIP-qPCR analysis using anti-pol II antibody (n=3, mean±s.e.m.). All asterisks (*) represent P<0.05, using Student's T-test.
Figure 5
Figure 5. H3 ubiquitination specifically recruits GCN5 for H3 acetylation.
(a) H3.3 knockdown impaired IL1α, IL1β and GCLM expression. qPCR was performed to analyse the mRNA level in control and H3.3 knockdown Hep3B cells (n=3, mean±s.e.m.). (b) H3 ubiquitination deficiency impaired IL1α, IL1β and GCLM expression. qPCR was performed to analyse the mRNA level in vector, H3.3 WT and H3.3 K23/36/37R mutant restored H3.3 knockdown Hep3B cells (n=3, mean±s.e.m.). (c) GCN5 is predicted as one of the potential regulator for NEDD4 target genes. Top 5,000 upregulated genes from microarray data sets in Fig. 4d were included to predict potential regulators by using iRegulon software. See experimental procedures for details. (d) GCN5 knockdown impaired IL1α, IL1β and GCLM expression. qPCR was performed to analyse the mRNA level in control and GCN5 knockdown cells (n=3, mean±s.e.m.). (e) GCN5 knockdown abolished glucose-induced H3 K9, K14, K27 and K56 acetylation. Control and GCN5 knockdown Hep3B cells were glucose-starved for 4 h and added-back glucose for 2 h before whole-cell extraction for western blot analysis. (f,g) NEDD4 knockdown impaired the interaction between GCN5 and H3.3. Transfected Flag-H3.3 or Flag-GCN5 in Hep3B cells was immunoprecipitated to analyse its co-immunoprecipitates by western blotting. (h) H3 ubiquitination deficiency impaired the interaction between GCN5 and H3.3. Hep3B cells were transfected with Flag-H3.3 WT or K23/36/37R for 36 h, then glucose starved for 4 h and added-back glucose for 2 h. Cells were then lysed for co-immunoprecipitation assay using anti-Flag antibody and subsequent western blot analysis. (i) GCN5 and ubiquitinated H3 form complex in vivo. 293T cells were transfected with Flag-GCN5 and His-Ub as indicated. Briefly, sequential purification is done by first IP with Flag antibody from whole-cell extracts in RIPA buffer. Immunoprecipitates were then released from antibody/beads by buffer A and followed by in vivo ubiquitination assay for endogenous H3. ChIP-qPCR data were all presented as relative enrichment to 5% input and 0.05 should be multiplied to calculate the actual enrichment percentage. All asterisks (*) represent P<0.05, using Student's T-test.
Figure 6
Figure 6. H3 ubiquitination is required tumour sphere forming and tumour engraftment.
(a) Cancer-related gene sets were enriched in control versus NEDD4 knockdown Hep3B cells. KEGG pathway gene sets enriched (P<0.05, q<0.25 for exploratory type of study) in control or NEDD4 knockdown were presented as orange or blue circles, respectively. Gene sets with overlapping genes were connected by green lines. The weight of the circle and line are proportional to the number of genes in gene set and overlapping genes between gene sets, respectively. See experimental procedures for details. (b) NEDD4 expression is correlated with NEDD4 target genes in TCGA hepatocarcinoma exon expression data sets. See experimental procedures for details. (cf) NEDD4, H3.3 and H3 ubiquitination are required for in vitro tumour sphere formation. NEDD4 knockdown, H3.3 knockdown or H3.3 WT or K23/36/37R restored Hep3B cells were analysed by in vitro tumour sphere-forming assay (see experimental procedures for details). Scale bar, 300 μm in length (c). Data were presented as the mean number of three biological replicates±s.e.m. (g,h) NEDD4 and H3 ubiquitination are required for maintaining Aldh+ cell population. Control and NEDD4 knockdown or H3 WT or K23/36/37R restored Hep3B cells were stained for Aldh enzymatic activity and analysed by flow cytometry. Data were presented as the mean percentage of three biological replicates±s.e.m. See experimental procedures for details. (ik) NEDD4 knockdown reduced in vivo tumour engraftment frequency of Du145 cells. Shown were tumour image, tumour incidence and tumour size, which was presented as the mean volume of tumours ((L × W × W)/2)±s.e.m. n=9 for each group and dead mice free of tumours are excluded. (ln) K23/36/37R mutation reduced in vivo tumour engraftment frequency of Du145 cells. Shown were tumour image, tumour incidence and tumour size, which was presented as the mean volume of tumours ((L × W × W)/2)±s.e.m. See experimental procedures for details. All asterisks (*) represent P<0.05, using Student's T-test.
Figure 7
Figure 7. IL1α/IL1β and ROS homeostasis are critical for tumour sphere-forming ability.
(a) Simultaneous neutralization of IL1α and IL1β abolished in vitro tumour sphere formation. Anti-IL1α (1:200) and anti-IL1β (1:200) neutralizing antibodies were added to medium on day 1 and day 4 after seeding Hep3B cells for in vitro tumour sphere-forming assay. Data were presented as the mean number of three biological replicates±s.e.m. See Supplementary Fig. 7a and experimental procedures for details. (b) IL1β and NAC co-treatment rescued the defect of NEDD4 knockdown in the in vitro tumour sphere formation. Control and NEDD4 knockdown Hep3B cells were treated with recombinant IL1β and/or NAC (0.5 mM) in the in vitro tumour sphere-forming assay. Data were presented as the mean number of three biological replicates±s.e.m. See Supplementary Fig. 7b and experimental procedures for details. (c,d) NEDD4 and H3 ubiquitination are required for the maintenance of cellular ROS. Control and NEDD4 knockdown or H3.3 WT or K23/36/37R restored Hep3B cells were stained by DCFDA for cellular ROS and subjected to flow cytometry analysis. Data were presented as the mean DCFDA signals of three biological replicates±s.e.m. See experimental procedures for details. (e) GSH level is reduced in NEDD4 knockdown cells. Control and NEDD4 knockdown Hep3B cells were collected and GSH levels were measured by a colorimetric enzymatic reaction. Data were presented as the mean value of three biological replicates±s.e.m. See experimental procedures for details. (f) Model of glucose-induced H3 mono-ubiquitination by NEDD4 and subsequent GCN5-mediated H3 acetylation, which regulates tumour sphere forming and tumour engraftment through transcription activation of genes, such as IL1A, IL1B and GCLM. N-tail represents histone H3 N-terminal tail. All asterisks (*) represent P<0.05, using Student's T-test.

Similar articles

Cited by

References

    1. Eberharter A. & Becker P. B. Histone acetylation: a switch between repressive and permissive chromatin. Second in review series on chromatin dynamics. EMBO Rep. 3, 224–229 (2002). - PMC - PubMed
    1. Graff J. & Tsai L. H. Histone acetylation: molecular mnemonics on the chromatin. Nat. Rev. Neurosci. 14, 97–111 (2013). - PubMed
    1. Brown C. E., Lechner T., Howe L. & Workman J. L. The many HATs of transcription coactivators. Trends Biochem. Sci. 25, 15–19 (2000). - PubMed
    1. Lee K. K. & Workman J. L. Histone acetyltransferase complexes: one size doesn't fit all. Nat. Rev. Mol. Cell Biol. 8, 284–295 (2007). - PubMed
    1. Smith K. T. & Workman J. L. Chromatin proteins: key responders to stress. PLoS Biol. 10, e1001371 (2012). - PMC - PubMed

Publication types