. 2017 Mar 16:7:41710.
doi: 10.1038/srep41710.

Actin-binding protein coronin 1A controls osteoclastic bone resorption by regulating lysosomal secretion of cathepsin K

Affiliations

Actin-binding protein coronin 1A controls osteoclastic bone resorption by regulating lysosomal secretion of cathepsin K

Saori Ohmae et al. Sci Rep. .

Abstract

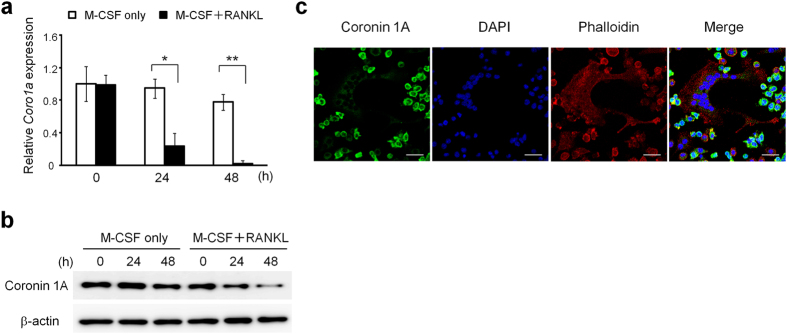
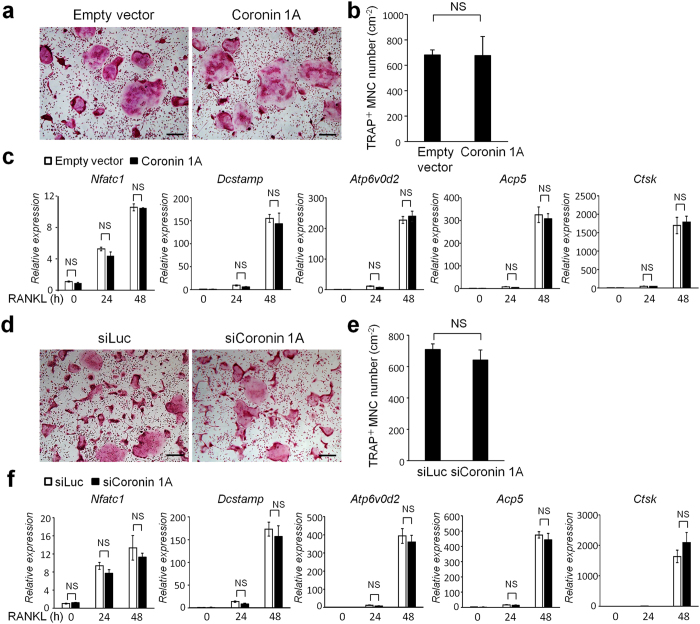
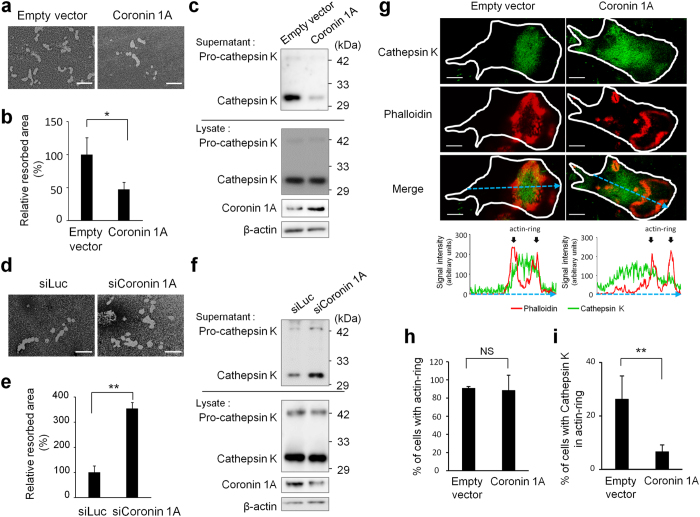
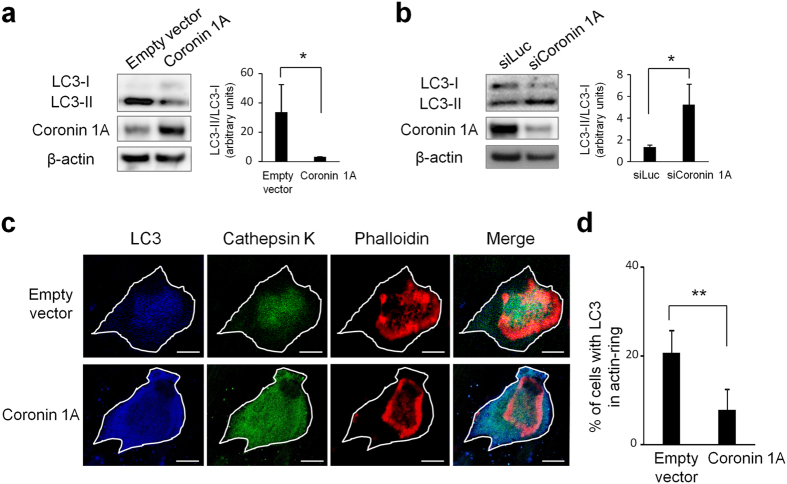
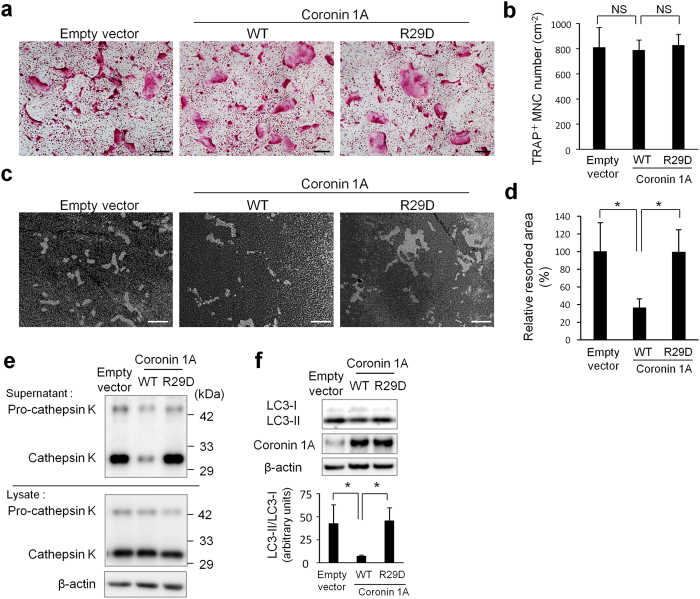
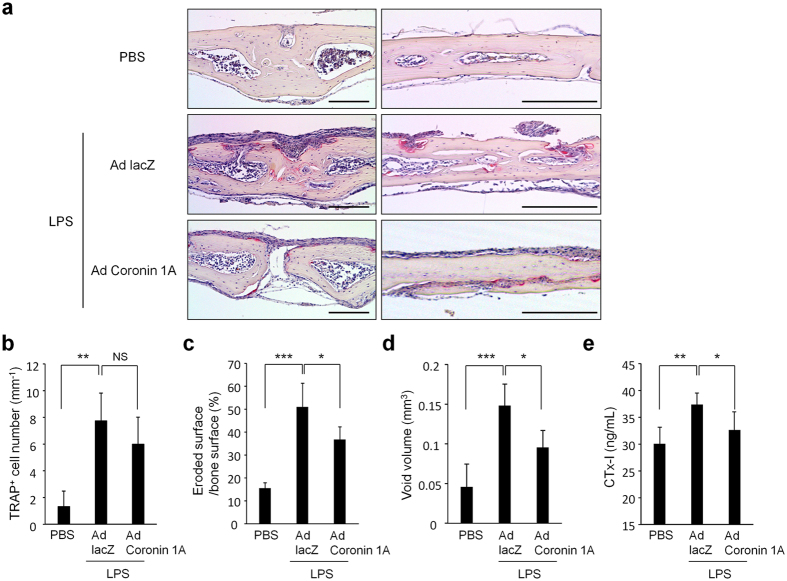
Osteoclasts degrade bone matrix proteins via the secretion of lysosomal enzymes. However, the precise mechanisms by which lysosomal components are transported and fused to the bone-apposed plasma membrane, termed ruffled border membrane, remain elusive. Here, we identified coronin 1A as a negative regulator of exocytotic release of cathepsin K, one of the most important bone-degrading enzymes in osteoclasts. The modulation of coronin 1A expression did not alter osteoclast differentiation and extracellular acidification, but strongly affected the secretion of cathepsin K and osteoclast bone-resorption activity, suggesting the coronin 1A-mediated regulation of lysosomal trafficking and protease exocytosis. Further analyses suggested that coronin 1A prevented the lipidation-mediated sorting of the autophagy-related protein LC3 to the ruffled border and attenuated lysosome-plasma membrane fusion. In this process, the interactions between coronin 1A and actin were crucial. Collectively, our findings indicate that coronin 1A is a pivotal component that regulates lysosomal fusion and the secretion pathway in osteoclast-lineage cells and may provide a novel therapeutic target for bone diseases.


Conflict of interest statement

S.O., T.F. and M. Asagiri were partly employed by the Coordination Fund from the Japan Science and Technology Agency and Astellas Pharma Inc.; and T.F. and M. Asagiri received research grants from this fund. K.I. is employed by the Coordination Fund from Kyoto University and Chugai Pharmaceutical Co., Ltd.; and receive research grants from this fund. The authors have no additional conflict of interests.

Figures

Figure 1
Figure 1. Coronin 1A was decreased during osteoclast differentiation.
(a,b) The expression of coronin 1A during osteoclastogenesis. The bone marrow macrophages (BMMs) were cultured in the presence of macrophage colony-stimulating factor (M-CSF) (10 ng/mL) and receptor activator of nuclear factor kappa-B ligand (RANKL) (50 ng/mL) for the indicated times, and analysed Coro1a mRNA (a) and coronin 1A protein level (b). Unprocessed original scans of blots are shown in Supplementary Fig. 10. *P < 0.05, **P < 0.01, (Student’s t-test). Data on Coro1a mRNA expression are means ± standard deviation (SD) of three independent experiments. (c) The intracellular localization of coronin 1A in osteoclasts. The osteoclasts were fixed, stained with anti-coronin 1A antibody, DAPI and phalloidin, and observed by confocal microscopy. Scale bars, 20 μm. Data are representative of three experiments.
Figure 2
Figure 2. Coronin 1A was dispensable for osteoclastogenesis.
(ac) BMMs were transduced with CSII-CMV-MCS-IRES2-Venus (empty vector) lentivirus or with lentivirus expressing coronin 1A, and then were cultured with M-CSF (10 ng/mL) and RANKL (50 ng/mL) to differentiate into osteoclasts. (a,b) Cultured cells were fixed and stained for tartrate-resistant acid phosphatase (TRAP). The numbers of TRAP-positive multinucleated cells (MNCs) (>3 nuclei) were counted. Data are means ± SD of three independent experiments. Scale bars, 200 μm. (Student’s t-test), NS: not-statistically significant. (c) Expression of osteoclast marker genes, Nfatc1, Dcstamp, Atp6v0d2, Acp5 and Ctsk during osteoclastogenesis. Total RNA was extracted from the cultured cells at the indicated time points and subjected to real-time PCR. (Student’s t-test), NS: not-statistically significant. (df) BMMs were transfected with luciferase- or coronin 1A-specific siRNA, and then were incubated with M-CSF and RANKL. (d,e), Osteoclast differentiation of the control and coronin 1A knockdown cells. The numbers of TRAP-positive MNCs (>3 nuclei) were counted. Data are means ± SD of three independent experiments. Scale bars, 200 μm. (Student’s t-test), NS: not-statistically significant. (f) Expression of osteoclast marker genes during osteoclast differentiation. Data are representative of three experiments. (Student’s t-test), NS: not-statistically significant.
Figure 3
Figure 3. Coronin 1A inhibited bone resorption in osteoclasts.
(ac,gj) BMMs were transduced with empty vector- (control) or coronin 1A-expressing lentivirus, and then were cultured with M-CSF (10 ng/mL) and RANKL (50 ng/mL) to differentiate into osteoclasts. (a,b) Osteoclasts were removed from the bone biomimetic synthetic surface plate and resorption pit areas were visualized by von Kossa staining. The bone resorption areas were analysed by using the MetaMorph software. Data are means ± SD of three independent experiments. *P < 0.05 for the indicated comparisons. Scale bars, 50 μm. (c) The amount of cathepsin K in cell lysates and supernatants. Cell lysates and supernatants were analysed by immunoblotting. Unprocessed original scans of blots are shown in Supplementary Fig. 10. (df) BMMs were transfected with luciferase- or coronin 1A-specific siRNA, and then were incubated with M-CSF and RANKL. (d,e) Bone resorption activity of control and coronin 1A knockdown cells. The resorption areas were analysed by using the MetaMorph software. Data are means ± SD of three independent experiments. **P < 0.01 for the indicated comparisons. Scale bars, 50 μm. (f) The amount of cathepsin K in cell lysates and supernatants. Unprocessed original scans of blots are shown in Supplementary Fig. 10. (g) Representative confocal images of control- and coronin 1A-overexpressing osteoclasts; actin, red; cathepsin K, green; cell perimeters, white. Scale bars, 20 μm. Graph indicates the intensity profile of the blue dotted line in each image. The blue dotted line passes through the centroid positions of each cell and actin-ring. (h) Percentage of control- or coronin 1A-overexpressing osteoclasts with actin ring; data are presented as mean ± SD, n = 35 in each group. (Student’s t-test). NS: not-statistically significant. (i,j) Percentage of cells with cathepsin K or lysosomal-associated membrane protein 1 (LAMP1) localized in actin-ring of control- or coronin 1A-overexpressing osteoclasts; data are presented as mean ± SD, n = 35 in each group. *P < 0.05, **P < 0.01, (Student’s t-test). Data are representative of three experiments.
Figure 4
Figure 4. Coronin 1A regulated the lipidation and localization of LC3 in osteoclasts.
(a) The amount of LC3 in cell lysates. Cell lysates of empty vector (control) or coronin 1A-overexpressing osteoclasts were analysed by immunoblotting. Right: The ratio of LC3-II to LC3-I was quantified from three independent experiments using ImageJ. Unprocessed original scans of blots are shown in Supplementary Fig. 11. *P < 0.05, (Student’s t-test). (b) Cell lysates of luciferase- or coronin 1A-knockdown osteoclasts were analysed by immunoblotting. Right: The ratio of LC3-II to LC3-I was quantified from three independent experiments using ImageJ. Unprocessed original scans of blots are shown in Supplementary Fig.11. *P < 0.05, (Student’s t-test). (c) Representative confocal images of control- and coronin 1A-overexpressing osteoclasts; actin, red; LC3, blue; cathepsin K, green; cell perimeters, white. Scale bars, 20 μm. (d) Percentage of control or coronin 1A-overexpressing osteoclasts with LC3 within the actin ring; data are presented as mean ± SD, n = 35 **P < 0.01, (Student’s t-test). Data are representative of three experiments.
Figure 5
Figure 5. Coronin 1A regulated bone resorption via actin-dependent mechanism.
(af) BMMs were transduced with empty vector (control) or coronin 1A (wild-type or R29D mutant)-expressing lentivirus, and then were cultured with M-CSF (10 ng/mL) and RANKL (50 ng/mL) to differentiate into osteoclasts. (a,b) Osteoclasts were fixed and stained for TRAP. The numbers of TRAP+ MNCs (>3 nuclei) were counted. Data are means ± SD of three independent experiments. Scale bars, 200 μm. (c,d) The osteoclasts were removed from the bone biomimetic synthetic surface plate and resorption pit areas were visualized by von Kossa staining and analysed by using the MetaMorph software. Data are means ± SD of three independent experiments. *P < 0.05 for the indicated comparisons. Scale bars, 50 μm. (e) The amount of cathepsin K in cell lysates and supernatants. Cell lysates and supernatants were analysed by immunoblotting. Unprocessed original scans of blots are shown in Supplementary Fig. 11. (f) The amount of LC3 in cell lysate. Right: The ratio of LC3-II to LC3-I was quantified from three independent experiments using ImageJ. Unprocessed original scans of blots are shown in Supplementary Fig. 11. *P < 0.05 for the indicated comparisons. Data are representative of three experiments.
Figure 6
Figure 6. Enforced-coronin 1A suppressed LPS-induced bone resorption.
Adenovirus expressing LacZ (Ad LacZ) or coronin 1A (Ad coronin 1A) and lipopolysaccharide (LPS) were injected onto calvariae in mice. (ac) TRAP staining was performed on sections of calvarial bones. Scale bars, 200 μm. Data are means ± SD from four mice for each condition. (d) The void volume on the surface of the calvarial bone was determined by micro-computed tomography. Data are means ± SD, n = 4, PBS or Ad LacZ-injected mice, n = 5, Ad coronin 1A injected mice. (e) The concentration of serum CTx-I was measured using ELISA. Data are means ± SD from seven mice for each condition. (be) The overall difference between the groups was determined by one-way analysis of variance (ANOVA). Post hoc multiple comparisons were made using the Dunnett test. *P < 0.05, **P < 0.01, ***P < 0.005. Data are representative of three experiments.

Similar articles

Cited by

References

    1. Suda T. et al.. Modulation of osteoclast differentiation and function by the new members of the tumor necrosis factor receptor and ligand families. Endocr Rev 20, 345–357 (1999). - PubMed
    1. Boyle W. J., Simonet W. S. & Lacey D. L. Osteoclast differentiation and activation. Nature 423, 337–342 (2003). - PubMed
    1. Asagiri M. et al.. Autoamplification of NFATc1 expression determines its essential role in bone homeostasis. J Exp Med 202, 1261–1269 (2005). - PMC - PubMed
    1. Asagiri M. & Takayanagi H. The molecular understanding of osteoclast differentiation. Bone 40, 251–264 (2007). - PubMed
    1. Baron R. et al.. Polarized secretion of lysosomal enzymes: co-distribution of cation-independent mannose-6-phosphate receptors and lysosomal enzymes along the osteoclast exocytic pathway. J Cell Biol 106, 1863–1872 (1988). - PMC - PubMed