. 2017 Mar 16:8:14797.
doi: 10.1038/ncomms14797.

The scaffold protein p140Cap limits ERBB2-mediated breast cancer progression interfering with Rac GTPase-controlled circuitries

Affiliations

The scaffold protein p140Cap limits ERBB2-mediated breast cancer progression interfering with Rac GTPase-controlled circuitries

Silvia Grasso et al. Nat Commun. .

Erratum in

Abstract

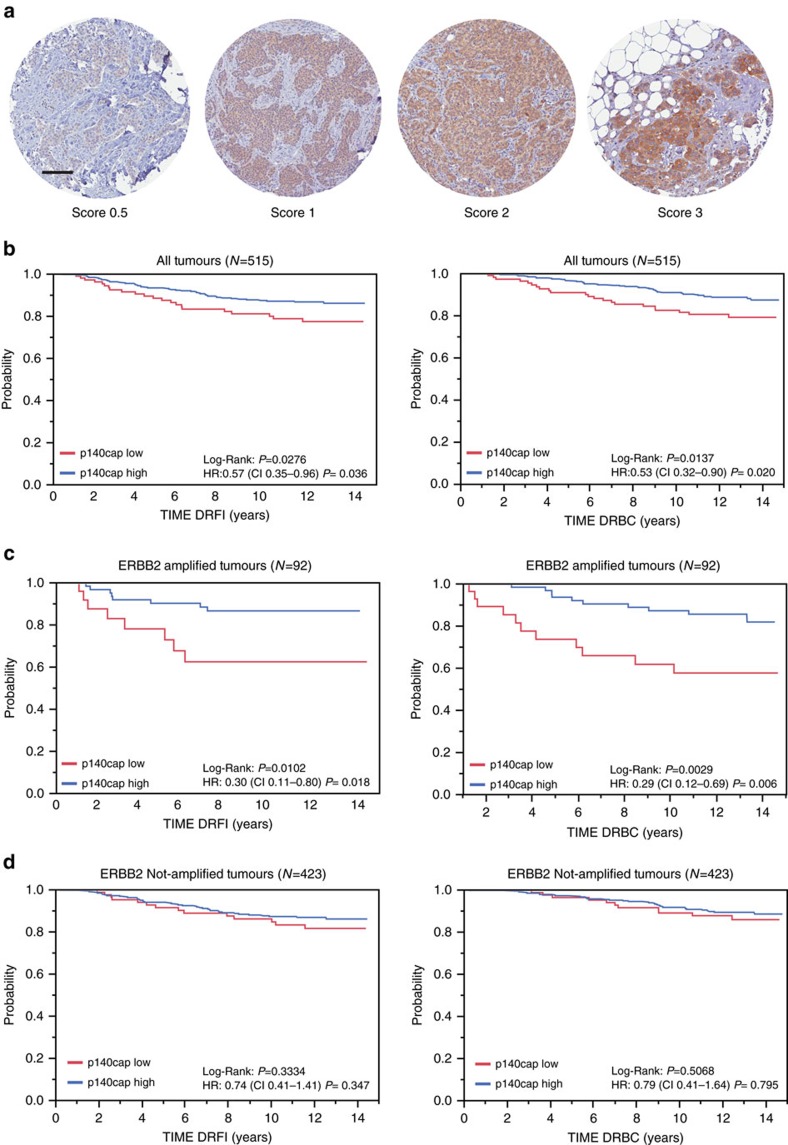
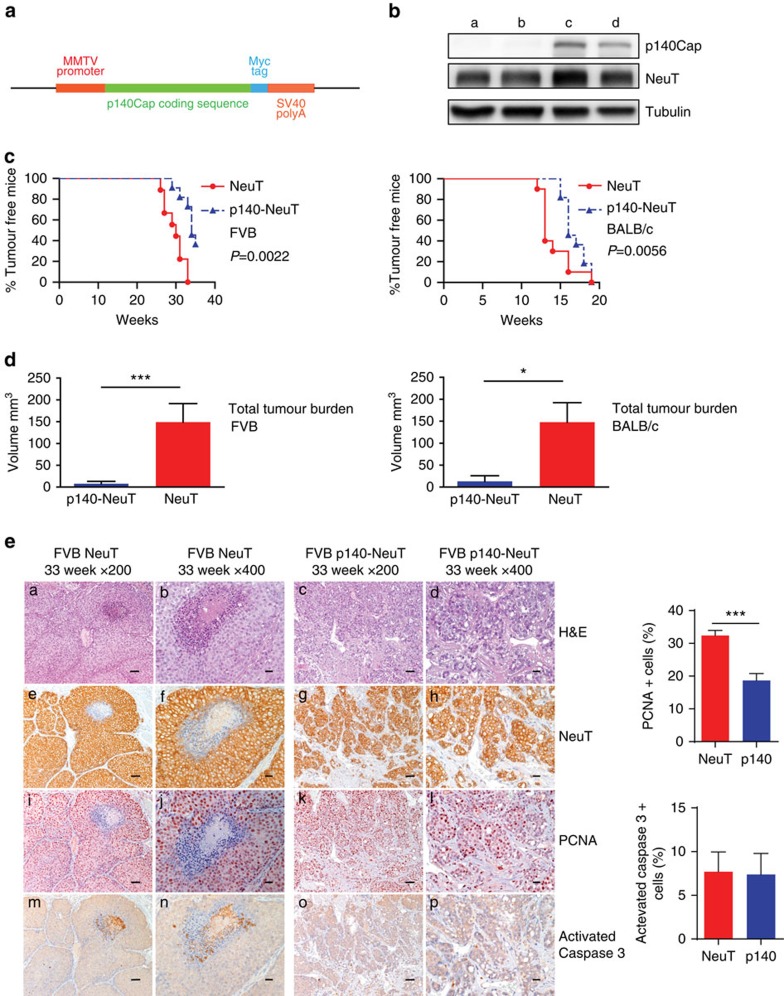
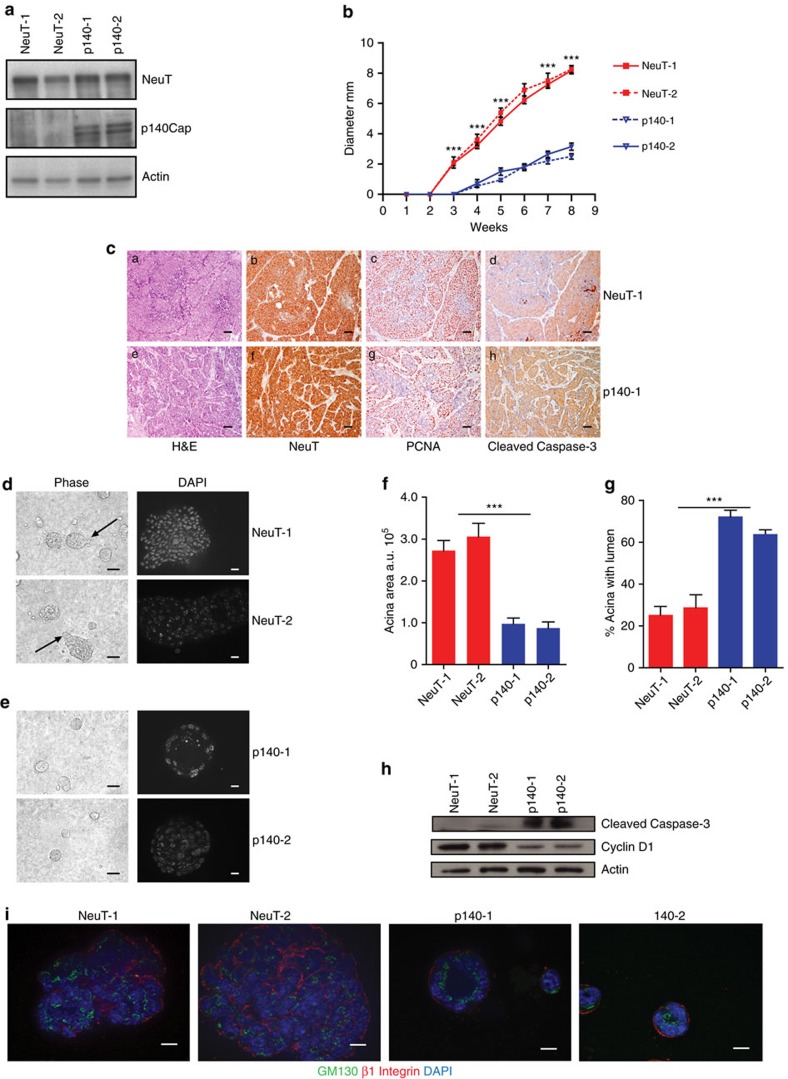
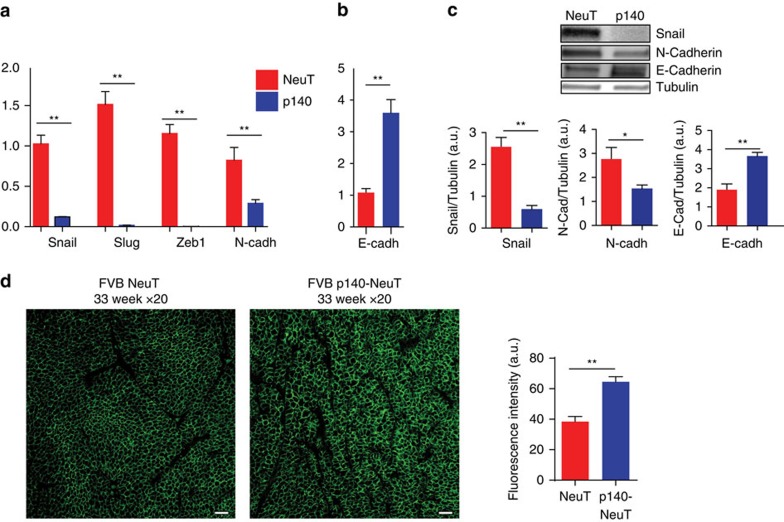
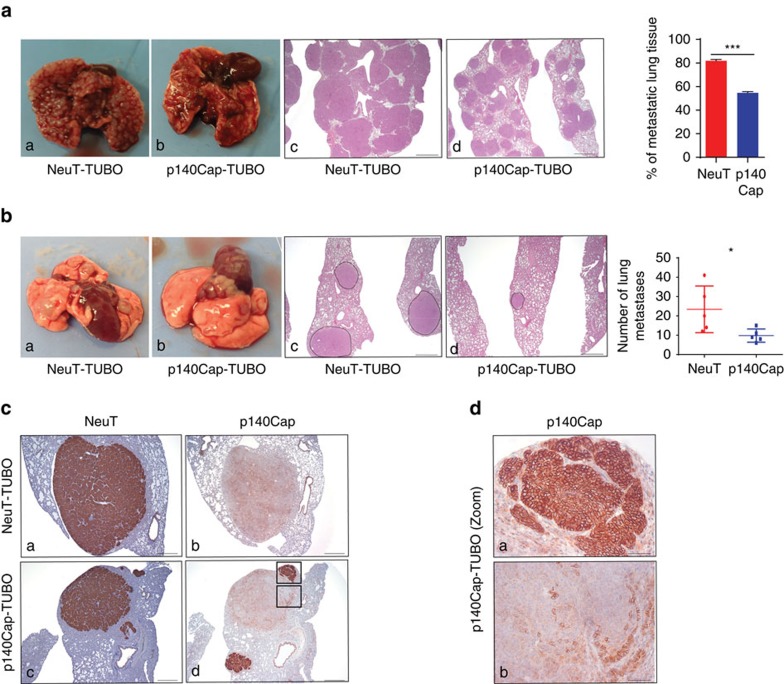
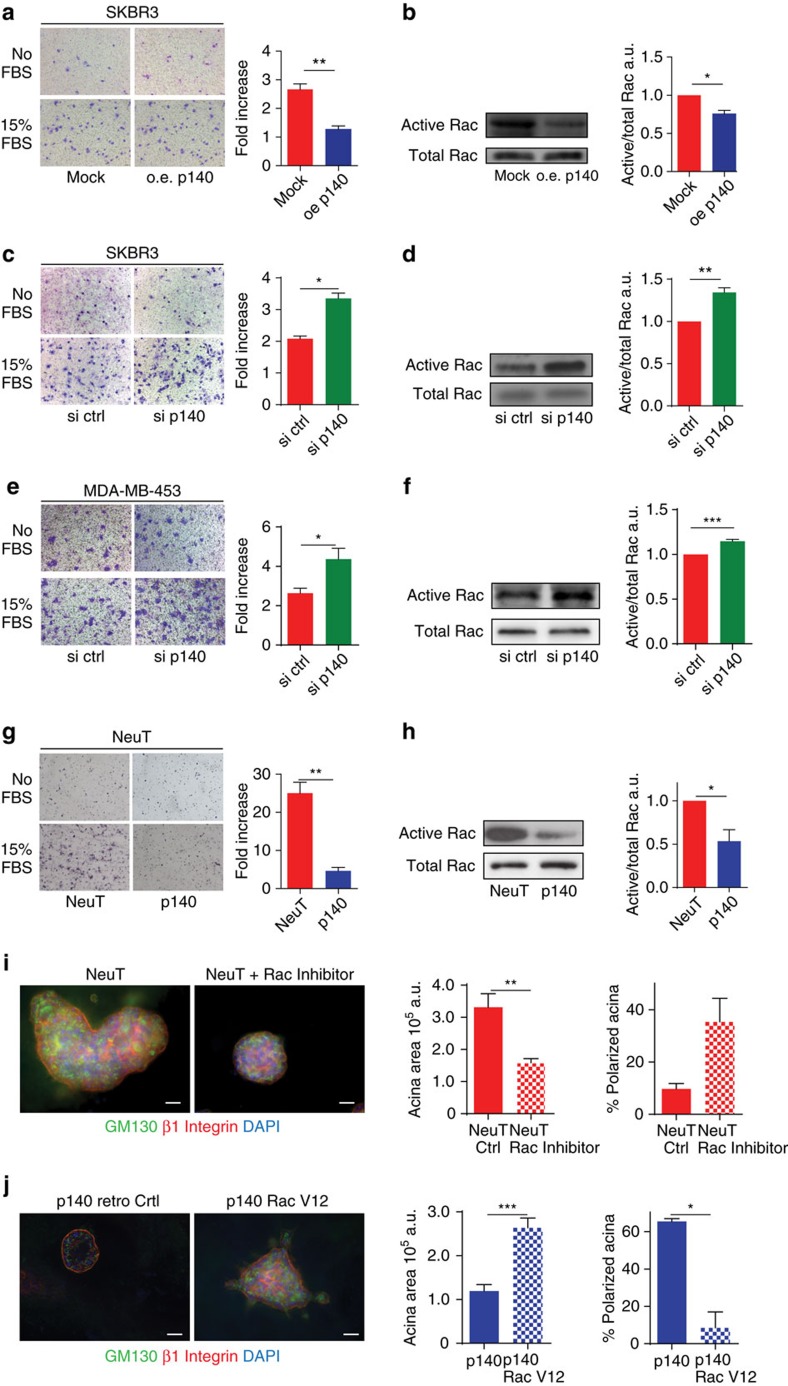
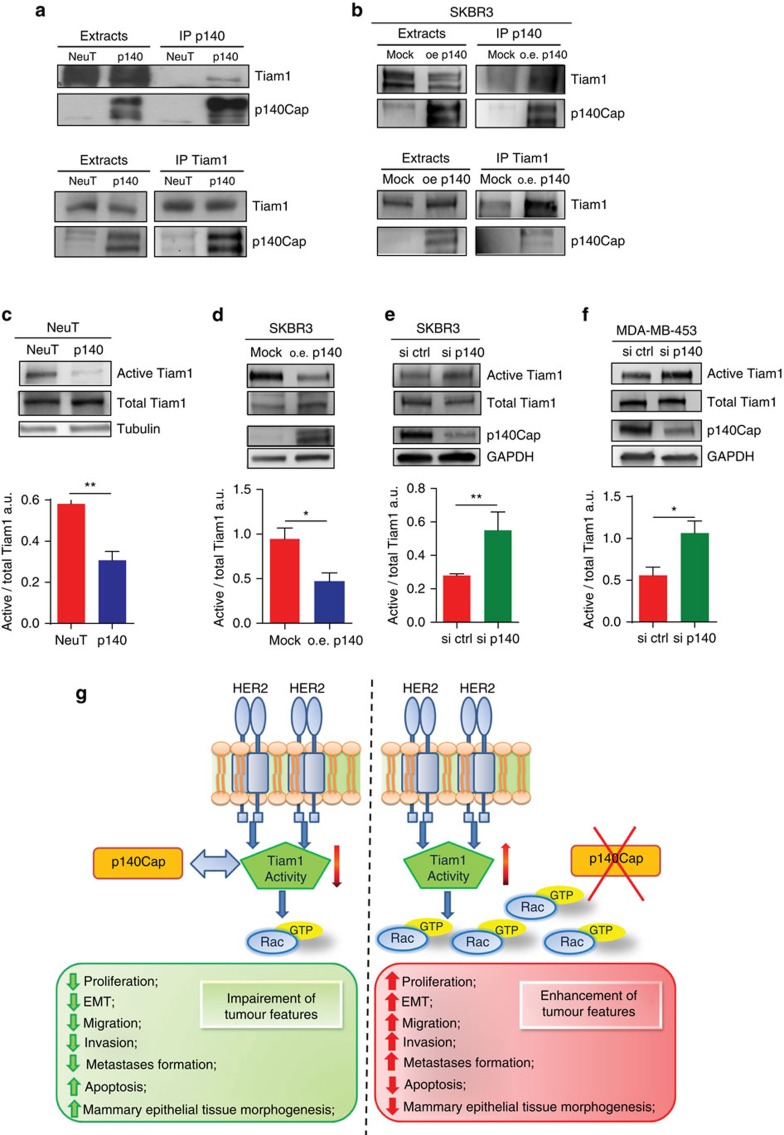
The docking protein p140Cap negatively regulates tumour cell features. Its relevance on breast cancer patient survival, as well as its ability to counteract relevant cancer signalling pathways, are not fully understood. Here we report that in patients with ERBB2-amplified breast cancer, a p140Cap-positive status associates with a significantly lower probability of developing a distant event, and a clear difference in survival. p140Cap dampens ERBB2-positive tumour cell progression, impairing tumour onset and growth in the NeuT mouse model, and counteracting epithelial mesenchymal transition, resulting in decreased metastasis formation. One major mechanism is the ability of p140Cap to interfere with ERBB2-dependent activation of Rac GTPase-controlled circuitries. Our findings point to a specific role of p140Cap in curbing the aggressiveness of ERBB2-amplified breast cancers and suggest that, due to its ability to impinge on specific molecular pathways, p140Cap may represent a predictive biomarker of response to targeted anti-ERBB2 therapies.


Conflict of interest statement

The authors declare no competing financial interests.

Figures

Figure 1
Figure 1. Prognostic relevance of p140Cap expression in breast tumours.
(a) p140Cap expression was measured by IHC on tissue microarray (TMA) samples. For the purpose of correlation with clinical and pathological parameters, tumours were classified based on the intensity of p140Cap staining as 0.5–3: p140Cap-Low (IHC score<1) and p140Cap-High (IHC score ≥1). Images are representative of p140Cap expression scoring according to intensity staining in TMA. In tumour tissues, the IHC signals were associated with the tumour cell component and not with the adjacent or infiltrating stroma. TMA data analysis was performed using JMP 10.0 statistical software (SAS Institute, Inc). Scale bar, 100 μm. (b) p140Cap expression in the whole cohort: Distant Recurrence Free Interval (DRFI) (left panel: hazard ratio: 0.57, P=0.036); and Death Related to Breast Cancer (DRBC; right panel: hazard ratio: 0.53, P=0.020). (c) p140Cap expression in ERBB2-positive patients: DRFI (left panel: hazard ratio: 0.30, P=0.018); and DRBC (right panel: hazard ratio: 0.29, P=0.006). (d) p140Cap expression in ERBB2-negative patients: DRFI (left panel: hazard ratio: 0.74, P=0.347); and DRBC (right panel: hazard ratio: 0.41, P=0.795). P=Pearson χ2-test.
Figure 2
Figure 2. SRCIN1 gene alterations in human ERBB2 breast cancer samples.
(a) SRCIN1 gene copy number across 200 ERBB2-amplified breast cancer samples analysed by aCGH. Y axis corresponds to log2 transformed copy number, where values >0 correspond to increased copy numbers, and values <0 to copy-number loss. Bars represent individual samples. (b) Correlation of SRCIN1 gene expression (GEX; y axis) and SRCIN1 gene copy number (x axis) for 50 ERBB2 amplified cases from ref. . To assess whether this increase in SRCIN1 gene copy number results in increased mRNA expression, gene expression data were compared with aCGH log2ratios using the Pearson correlation as described in ref. . Pearson’s coefficient of correlation is 0.77. (c) p140Cap FISH of breast cancer tissues. Representative images of two cases of ERBB2 amplified tissues, labelled with a mix of two probes SRCIN1/CEP1; Red (SRCIN1) and green (CEP17) spots were automatically acquired at 40X, using Metafer, by a MetaSystem scanning station. left panel: 95% SRCIN1 amplification; average SRCIN1/nuclei=11.7; right panel: 90% SRCIN1 amplification; average SRCIN1/nuclei=13,4. Scale bar, 10 μm.
Figure 3
Figure 3. p140Cap expression is causative in limiting tumour growth in NeuT mice.
(a) Expression cassette used for the generation of MMTV-p140Cap transgenic mice. The Myc epitope is inserted at the carboxyterminal region of the protein. (b) Extracts of tumours derived from NeuT mice (a,b) or p140-NeuT mice (c,d) were run on 6% SDS–PAGE and stained with antibodies to p140Cap, ERBB2 and tubulin for loading control. (c) Percentage of tumour free mice in NeuT (red line) and p140-NeuT (blue-dashed line) transgenic animals in both FVB (left) or BALB/c background (right). Twelve mice were analysed for each group. Fisher’s exact test, Two sided, P=0,0022; P=0,0056. Error bar: s.e.m. (d) Total tumour burden in NeuT (red) and p140-NeuT (blue) mice in both the FVB (left) or BALB/c backgrounds (right) was measured. Ten mice were analysed in each group. Unpaired t test: (*P<0.05; ***P<0.001). Error bar: s.e.m. (e) Paraffin-embedded sections from three NeuT and three p140-NeuT tumours taken from mice at 33 weeks of age were analysed for hematoxylin–eosin (H&E) (a–d) and for immunohistochemistry with antibodies to NeuT (e–h), PCNA (i–l) and activated Caspase3 (m–p). Representative images are shown. Scale bar, 50 μm (first and third columns); 20μm (second and fourth columns). Histograms on the right show the percentage of PCNA+ (upper panel) and Activated Caspase3+ (lower panel) cells. Statistical significative differences were evaluated using unpaired t-tests (***P<0.001).
Figure 4
Figure 4. Primary p140 cancer cells restore mammary epithelial acina morphogenesis in 3D Matrigel-Collagen cultures.
(a) Protein extracts from two independent primary cancer cells for each genotype (NeuT-1, NeuT-2, p140-1 and p140-2) were run on 6% SDS–PAGE and stained with antibodies to NeuT, p140Cap and actin for loading control. (b) 106 cells as in a were injected in the left and right fat pads of nude mice. Tumour diameters were measured every week for 8 weeks. Two independent experiments were performed using five mice per group. Differences in tumour diameter were evaluated using two-way analysis of variance (ANOVA) followed by Bonferroni multiple comparison post hoc tests (***P<0.001). (c) Paraffin-embedded sections were prepared at the end of the experiments from tumours derived from mice as in b. Sections were analysed for Hematoxylin–Eosin (a,e), and for immunohistochemistry with antibodies to NeuT (b,f), PCNA (c,g) and activated Caspase3 (d,h). Representative images are shown. Scale bar, 50 μm. (d,e) Primary cancer cells for each genotype (NeuT-1, NeuT-2, p140-1, and p140-2) were plated in Matrigel/Collagen I 1:1 and left to grow for 15 days. Day 15 acina are shown as phase images in the left panels, or as Dapi nuclei staining (bright grey) in right panels. Arrows indicate the presence of invasive protrusions. Representative images from three independent experiments are shown. Scale bar, 50 μm. (f) The histogram represents the area of the acina quantified by the computer-generated software Zeiss Axiovision 4.5 and shown in arbitrary units (a.u.). (g) The histogram represents the percentage of acina structures with an internal lumen. The lumen has been manually quantified. In f and g, statistical significative differences were evaluated using unpaired t tests. Error bar: s.e.m. (***P<0.001). (h) Primary cancer cells as in d were plated in Matrigel/Collagen I 1:1 and left to grow for 12 days. Protein extracts were run on 4–12% SDS–PAGE and stained with antibodies to Cleaved Caspase 3, Cyclin D1 and Actin for loading control. (i) Primary cancer cells as in d were analysed as day 15 acinar structures by immunostaining for a cis-Golgi matrix protein, GM130 (green), and a basal marker protein, beta1 integrin (red). Nuclei were co stained with DAPI (blue). Representative images are shown. Scale bar, 50 μm.
Figure 5
Figure 5. Primary p140 cancer cells show impaired progression features.
(a,b) RT–PCR was performed to quantify mRNA expression of EMT markers in NeuT and p140 cancer cell RNA. RNA was prepared from three biological replicates. RT–PCR was performed on triplicates. CNRQ (calibrated normalized relative quantity) is shown in arbitrary units (a.u.). Error bar: s.e.m. (c) Protein extracts from NeuT and p140 cells were run on 4–15% SDS–PAGE and stained with antibodies to Snail, N-cadherin and E-cadherin. Tubulin was used as an internal standard for protein loading. Histograms show in a.u. the quantification of three independent experiments. Statistical significative differences were evaluated using unpaired t tests (*P<0.05; **P<0.01; ***P<0.001). Error bar: s.e.m. (d) Paraffin-embedded sections from three NeuT and three p140-NeuT tumours taken from mice at 33 weeks of age were analysed for immunofluorescence with antibodies to E-Cadherin (green). Representative images are shown. Scale bar, 50 μm. Image acquisition was performed using Zeiss LSM 510 META confocal microscope. The E-cadherin mean fluorescence intensity was evaluated on the digital images of three tumours per group (4 × 200 microscopic fields per sample) with ImageJ, using the Mean Gray Value.
Figure 6
Figure 6. p140Cap impairs spontaneous metastasis.
(a,b) Representative gross observation (a,b), hematoxylin and eosin sections (c,d) and quantitative analysis in the experimental lung metastasis assay (a) and in the spontaneous lung metastasis assay (b). In a, 5 × 10⁴ cells were injected into the tail vein of NSG mice. After 4 weeks, the lungs were explanted and analysed. Two independent experiments were performed using five mice per group. The histogram shows the percentage of metastatic lung tissue on total lung area. Statistical significance was evaluated with unpaired t-test (***P<0.001). Error bar: s.e.m. In b, 105 cells were injected in the right fat pads of NSG mice. Tumour volumes were measured every week; tumours were surgically removed when they reached a 10 mm diameter. After 5 weeks, mice were killed and lungs were explanted. The histogram shows the number of lung metastasis. Statistical significance was evaluated with unpaired t-test (*P<0.1). Error bar: s.e.m. Scale bar (a,b): 800 μm. (c) NeuT (a,c) and p140Cap expression (b,d) in spontaneous lung metastasis of mice injected with NeuT-TUBO cells (a,b) and mice injected with p140-TUBO cells (c,d). Scale bar, 400 μm. (d) High-magnification fields of rectangular areas in c, (panel d). Scale bar, 50 μm.
Figure 7
Figure 7. p140Cap negatively controls ERBB2-driven migratory ability and Rac GTPase activity.
(a,c,e,g) Representative images of Transwell migration assays. 105 cells were left to migrate for 24 h in the presence or the absence of 15% FBS, fixed, stained and counted. Histograms represent on the y axes the fold increase (ratio between the number of cells migrated in the presence and in the absence of FBS), from three independent experiments, performed in triplicate. Error bar: s.e.m. (a) p140Cap over-expressing (oe p140) or mock SKBR3 (mock) cells. (c) SKBR3 cells transiently transfected with ON-TARGET plus human SRCIN1 small-interfering RNA (si p140) or ON-TARGET plus non-targeting siRNA (Dharmacon RNAi; si ctrl). This patented approach strongly prevents off-target effects. (e) MDA-MB-453 cells transiently transfected with ON-TARGET plus small-interfering RNA as in c. (g) Primary NeuT and p140 cancer cells. (b,d,f,h) Active Rac pull-down from cells like in (a,c,e,g). Eluted material (upper panels) and cell extracts (lower panels) run on 12% SDS–PAGE revealed with anti Rac antibodies. Histograms show the ratio between active and total Rac protein levels in arbitrary units (a.u.) from five independent experiments. Statistical significative differences were evaluated using umpaired t tests (*P<0.05; **P<0.01). Error bar: s.e.m. (i) Primary NeuT cells were grown in Matrigel/CollagenI 1:1 for 1 week, before seven days treatment with 80μM Rac1 inhibitor NSC23766 and acini immunostained for GM130 (green), beta1 integrin (red) and DAPI for nuclei. Scale bar, 50 μm. Histograms represent quantification of acina area (left) and polarity (right) from three independent experiments. Differences in acina area were evaluated using a Mann–Whitney non parametric t-test (***P<0.001). Error bar: s.e.m. (j) p140 primary cancer cells were infected with retroviral particles that express Rac1-V12 or empty vector (retro Ctrl). Cells were plated in Matrigel/Collagen I 1:1 and day 15 acinar structures were immunostained as in i. Scale bar, 50 μm. Quantification of acini area in a.u., percentage of polarized acina and percentage of acina with protrusions are reported. The values from two independent experiments are reported. Differences were evaluated using a Mann–Whitney non parametric t-test (***P<0.0001; *P<0.05). Error bar: s.e.m.
Figure 8
Figure 8. p140Cap expression negatively regulates Tiam1 activity.
(a,b) Extracts from NeuT and p140 expressing cancer cells, and p140 overexpressing (o.e.), or mock (mock) SKBR3 cells were immunoprecipitated with antibodies to p140Cap (upper panels) or Tiam1 (lower panels). Cell extracts and immunoprecipates were run on 6% SDS–PAGE and blotted with antibodies to p140Cap and Tiam1. Representative images from five independent experiments are shown. (cf) The level of active Tiam1 was determined using the active Rac-GEF assay kit in NeuT, p140 primary cancer cells, p140 o.e. or mock (mock) SKBR3 cells, and p140 silenced SKBR3 (si p140) and MDA-MB-453 (si p140) cells. Equal amount of extracts were incubated for 1 h at 4 °C with Rac G15A agarose beads. Active Tiam1 and total Tiam1 levels were determined using an anti-Tiam1 antibody for western blot detection, from eluted material and input fractions, respectively. Antibodies to tubulin and GAPDH were used as loading controls. The histogram represents the quantification of active Tiam1 in three independent experiments, normalizing active Tiam1 levels to the corresponding total Tiam1 levels in arbitrary units (A.U.). In cf, statistical significative differences were evaluated using unpaired t-tests (*P<0.05; **P<0.01). Error bar: s.e.m. (g) p140Cap exhibits a suppressive function on ERBB2 tumour features. In ERBB2 cancer cells, when p140Cap is expressed, proliferation, EMT, migration and metastasis formation are impaired and cancer cells enhance apoptosis and restore the proper mammary epithelial tissue morphogenesis disrupted by the ERBB2 oncogene. Moreover, the Tiam1/Rac signalling pathway is strongly decreased, through the ability of p140Cap to associating with Tiam1 and to downregulating its activity. On the contrary, when p140Cap is undetectable, Tiam1/Rac signalling pathway is active, and cancer cells exhibit an aggressive phenotype. The molecular mechanisms here reported link p140Cap expression with decreased metastatic risk in ERBB2 patients.

Similar articles

Cited by

References

    1. Siegel R. et al.. Cancer treatment and survivorship statistics, 2012. CA Cancer J. Clin. 62, 220–241 (2012). - PubMed
    1. Cancer Genome Atlas N. Comprehensive molecular portraits of human breast tumours. Nature 490, 61–70 (2012). - PMC - PubMed
    1. Slamon D. J. et al.. Human breast cancer: correlation of relapse and survival with amplification of the HER-2/neu oncogene. Science 235, 177–182 (1987). - PubMed
    1. Hynes N. E. & MacDonald G. ErbB receptors and signaling pathways in cancer. Curr. Opin. Cell Biol. 21, 177–184 (2009). - PubMed
    1. Arteaga C. L. & Engelman J. A. ERBB receptors: from oncogene discovery to basic science to mechanism-based cancer therapeutics. Cancer Cell 25, 282–303 (2014). - PMC - PubMed

Publication types

MeSH terms