. 2017 Mar 16:7:44613.
doi: 10.1038/srep44613.

Effects of Gliadin consumption on the Intestinal Microbiota and Metabolic Homeostasis in Mice Fed a High-fat Diet

Affiliations

Effects of Gliadin consumption on the Intestinal Microbiota and Metabolic Homeostasis in Mice Fed a High-fat Diet

Li Zhang et al. Sci Rep. .

Abstract

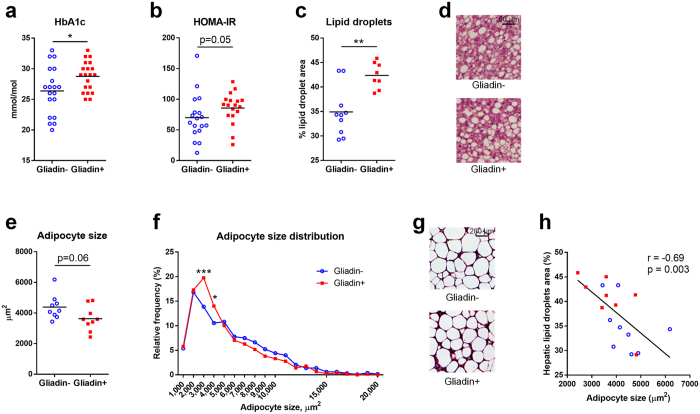
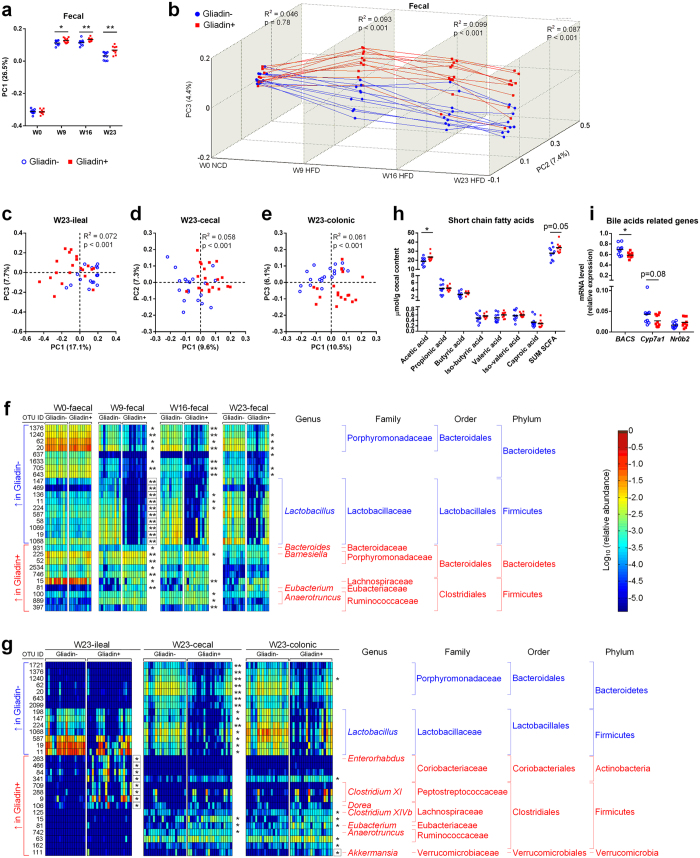
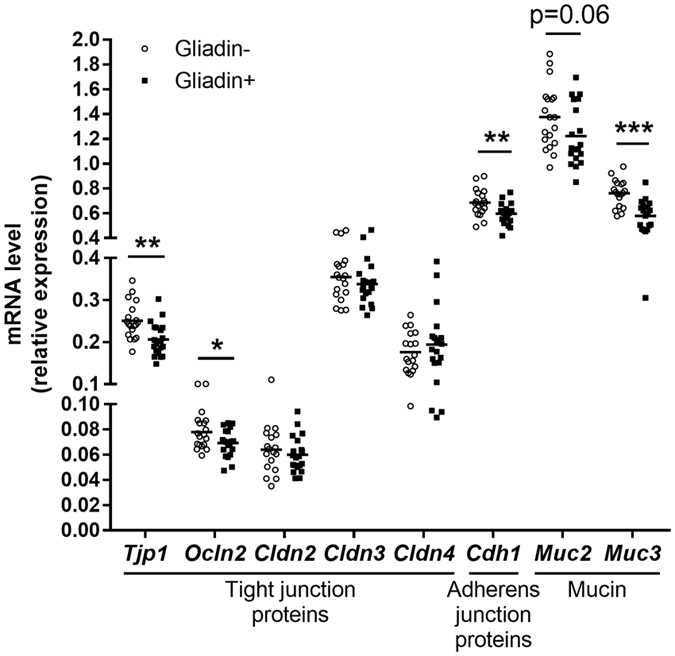
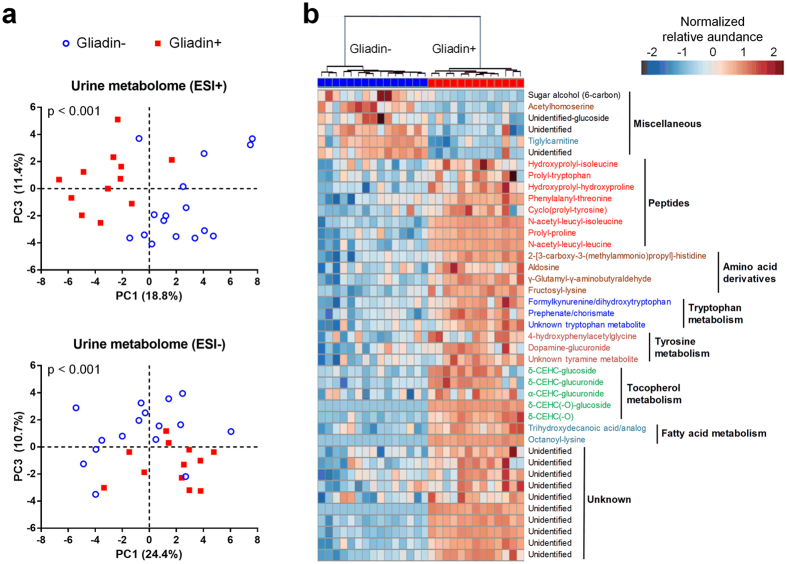
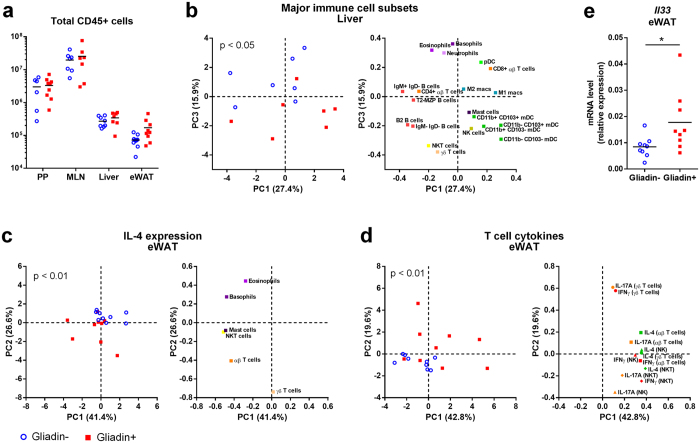
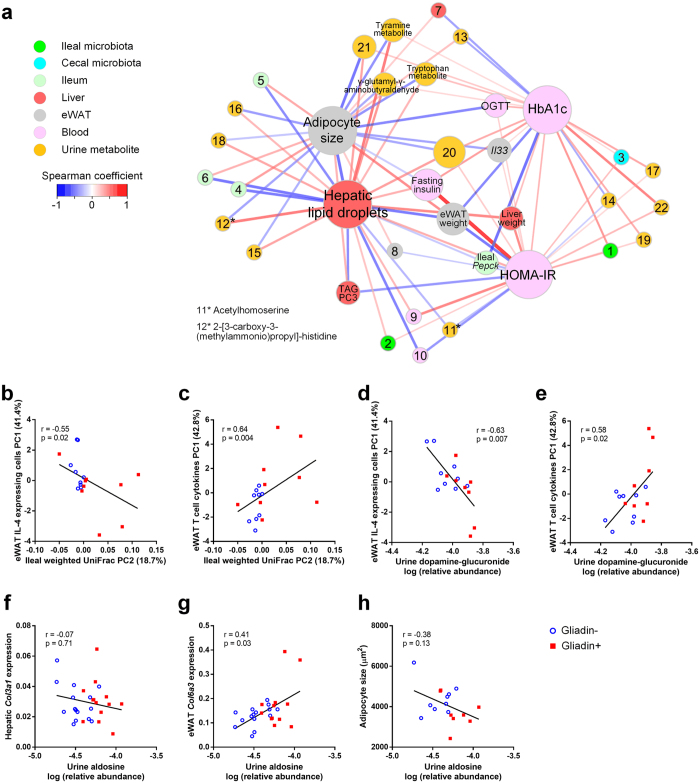
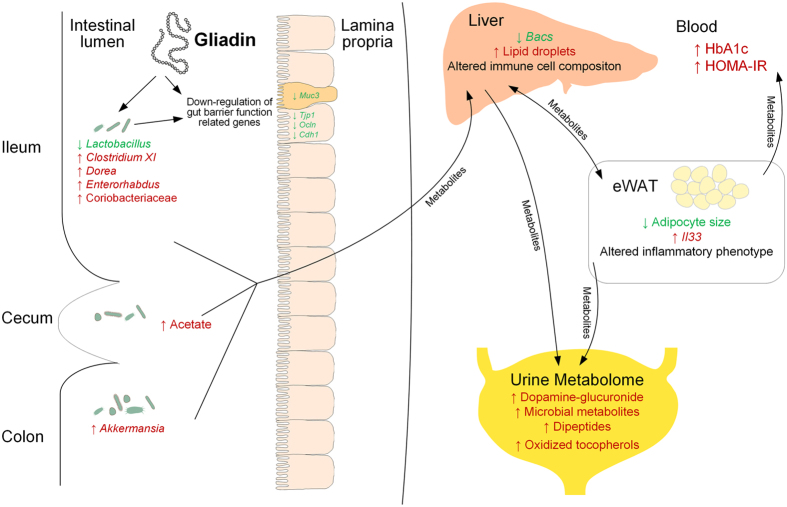
Dietary gluten causes severe disorders like celiac disease in gluten-intolerant humans. However, currently understanding of its impact in tolerant individuals is limited. Our objective was to test whether gliadin, one of the detrimental parts of gluten, would impact the metabolic effects of an obesogenic diet. Mice were fed either a defined high-fat diet (HFD) containing 4% gliadin (n = 20), or a gliadin-free, isocaloric HFD (n = 20) for 23 weeks. Combined analysis of several parameters including insulin resistance, histology of liver and adipose tissue, intestinal microbiota in three gut compartments, gut barrier function, gene expression, urinary metabolites and immune profiles in intestinal, lymphoid, liver and adipose tissues was performed. Mice fed the gliadin-containing HFD displayed higher glycated hemoglobin and higher insulin resistance as evaluated by the homeostasis model assessment, more hepatic lipid accumulation and smaller adipocytes than mice fed the gliadin-free HFD. This was accompanied by alterations in the composition and activity of the gut microbiota, gut barrier function, urine metabolome, and immune phenotypes within liver and adipose tissue. Our results reveal that gliadin disturbs the intestinal environment and affects metabolic homeostasis in obese mice, suggesting a detrimental effect of gluten intake in gluten-tolerant subjects consuming a high-fat diet.


Conflict of interest statement

The authors declare no competing financial interests.

Figures

Figure 1
Figure 1. Gliadin affected glucose homeostasis, liver lipid accumulation and adipocyte size in eWAT.
Mice were fed HFD (60% energy originating from fat) with gliadin (Gliadin+, n = 20) or without (Gliadin−, n = 19) for 23 weeks and subjected to measurements of metabolic features at termination. Panel (a) shows HbA1c levels in blood, (b) HOMA-IR, (c) percentage of lipid droplet area of the liver (each data point represents the average of six squares of 40,000 μm2), (d) hematoxylin- and eosin-stained hepatic sections, e the median adipocyte size of four different adipose tissue sections, (f) the relative frequency of the mean adipocyte size of four different adipose tissue sections, (g) hematoxylin- and eosin-stained eWAT sections, and h Spearman correlation between adipocyte size in eWAT and total lipid droplet area in the liver. In panels (a–c) and (e), horizontal lines represent the means, while asterisks represent statistically significant differences between the two feeding groups (*p < 0.05, **p < 0.01, unpaired t test or Mann-Whitney test). In panel (f), asterisks represent false discovery rate (FDR) corrected p values from multiple t tests (*q < 0.05, ***q < 0.001). In panel (h), the p value and r coefficient of Spearman correlation are listed, and the linear regression line is shown. In panels (c–h), n = 9–10 mice per group. See also Supplementary Fig. S1 and Supplementary Table S2.
Figure 2
Figure 2. Gliadin intake altered intestinal microbial composition and activity.
Microbiota analysis was performed on faecal samples collected from 10–11 cages per group at Week 0, 9, 16 and 23 and on terminal ileal, caecal and colonic luminal samples (n = 18–20 mice per group) by sequencing the V3 region of bacterial 16S rRNA genes followed by PCoA on unweighted UniFrac distances (ae). Panel (a) shows that the HFD feeding, initiated after Week 0, affected the first coordinate (PC1) of the microbiota composition, while (b) shows the longitudinal effect of Gliadin feeding. Panels (c–e) show that Gliadin feeding affected the ileal, caecal and colonic microbiota in samples obtained at termination. In panel (a), asterisks represent significant differences between the two groups (*p < 0.05, **p < 0.01, unpaired t test or Mann-Whitney test), while in panels (b–e), p values are listed for differential clustering (ADONIS test) and R2 values represent the percentages of variation explained by gliadin intake. NCD designates Normal Chow Diet, HFD designates High-Fat Diet. Heatmaps (f,g) show the relative abundances of OTUs differing between the Gliadin− and Gliadin+ mice in faecal and intestinal samples. Taxonomy is reported at the lowest identifiable level. OTUs that are more abundant in the Gliadin+ group are indicated in red and those less abundant in blue. Statistical comparison of the two groups was done by 10,000 times of permutation; p values represent fraction of times that permuted differences assessed by Welch’s t test were greater than or equal to real differences, and were adjusted by FDR correction (*q < 0.05, **q < 0.01). Boxes surrounding asterisks indicate >ten-fold differences in OTU abundances between the two groups. For faecal samples, only OTUs that have at least one q < 0.02 are shown. Short chain fatty acid concentrations in caecum (h) and hepatic mRNA levels of bile acid related genes (i) were measured at termination (n = 9–10 non-fasted mice per group). The mean of each group is shown by a horizontal line. Asterisks represent statistically significant differences (*p < 0.05, unpaired t test or Mann-Whitney test). See also Supplementary Fig. S2.
Figure 3
Figure 3. Gliadin intake decreased ileal expression of barrier function related genes.
Ileal tissue mRNA levels of barrier function related genes in Gliadin− (n = 19) and Gliadin+ (n = 20) mice at termination. The mean of each group is shown by a horizontal line. Asterisks represent statistically significant differences between the two groups (*p < 0.05, **p < 0.01, ***p < 0.001, unpaired t test or Mann-Whitney test). See also Supplementary Fig. S3.
Figure 4
Figure 4. Gliadin affected the metabolic signature of urine.
UPLC-MS-based global profiling of metabolites in urine from non-fasted Gliadin− (n = 15) and Gliadin+ (n = 13) mice at termination. PCA was performed on urine metabolome in positive (ESI+) and negative ionization (ESI−) mode respectively (a). Data were log-transformed and mean-centered. P values originate from Hotelling’s T2 test with 100,000 permutations. The heatmap (b) shows the normalized relative abundances of urinary metabolites differing between Gliadin− and Gliadin+ mice (q < 0.05, unpaired t test with Welch’s correction followed by FDR correction). Blue colors indicate relative abundances below and red indicate relative abundances above the mean of all samples. Data were log-transformed and the most abundant ion representing each metabolite was included. See also Supplementary Table S3.
Figure 5
Figure 5. Gliadin altered the composition of immune cells in liver and inflammatory phenotype in eWAT.
Composition of immune cells measured by flow cytometry of samples from Gliadin− and Gliadin+ non-fasted mice (n = 6–10 per group) at termination. Panel a shows total CD45+ leukocyte numbers in Peyer’s patches (PP), mesenteric lymph nodes (MLN), liver and eWAT. Horizontal lines represent means. Panel (b) shows a PCA of the major immune cell subsets in liver, (c) of the median fluorescence intensity of IL-4 in IL-4 expressing immune cells in eWAT, and (d) of the median fluorescence intensity of intracellular IFN-γ, IL-4 and IL-17A production in T and NK cells in eWAT. Panel (e) shows Il33 mRNA levels in eWAT. In panels (a) and (e), the mean of each group is shown by a horizontal line, while asterisks represent statistically significant differences (*p < 0.05, unpaired t test or Mann-Whitney test). In panels (b–d), data were center log ratio-transformed and mean-centered, and p values originate from Hotelling’s T2 test with 100,000 permutations. See also Supplementary Figs S4–S6 and Supplementary Table S4.
Figure 6
Figure 6. Combining Alterations in Microbiome and Host Metabolic Features.
Panel (a) shows an interaction network built from Spearman correlations (p < 0.05) between four metabolic endpoints (hepatic lipid droplets, adipocyte size, HbA1c and HOMA-IR) and other parameters, including discriminating bacterial groups (q < 0.05) and microbial α diversity, discriminating urinary metabolites (q < 0.05), caecal SCFAs and other host parameters. Each node represents a parameter and the size of the node reflects the number of correlating nodes. Nodes associated with 3–4 key metabolic endpoints are shown by names instead of numbers. Lines represent correlations, and are colored red for positive and blue for negative correlations, while their thickness represents the strength of the correlation. Nodes are positioned using an organic layout in Cytoscape, and only nodes that connect to more than two other nodes are shown. 1, ileal Clostridium XI; 2, ileal Enterorhabdus; 3, caecal microbiota Shannon index; 4, ileal Tjp1; 5, ileal Ocln; 6, ileal Cdh1; 7, hepatic Bacs; 8, eWAT Dgat1; 9, circulating IL-1β; 10, circulating IFN-γ; 11*, acetylhomoserine; 12*, 2-[3-carboxy-3-(methylammonio)propyl]-histidine; 13, sugar alcohol (6-carbon); 14, unidentified glucoside; 15, N-acetyl-leucyl-isoleucine; 16, prolyl-proline; 17, trihydroxydecanoic acid/analog; 18, U148.1332; 19, U222.0441; 20, U301.212; 21, U344.2276; 22, U359.2176. Specific correlations (b–h) based on biological hypotheses generated by observations of Gliadin+ and Gliadin− samples. The individual hypotheses are described in the section ‘Combining Alterations in Microbiome and Host Metabolic Features’. P values and r coefficients of Spearman correlations are listed, and linear regression lines are shown. See also Supplementary Fig. S7.
Figure 7
Figure 7. Schematic representation of the hypothesized effects of gliadin intake in a HFD-fed host.
Ingested gliadin is not fully degraded by host digestive enzymes, leaving biologically active peptides in the gut. Gliadin peptides may directly affect gut barrier integrity, but can also alter the gut microbial composition and activities, thereby disturbing particularly the ileal gut barrier function. HFD together with increased gut permeability facilitate the influx of substances including microbial metabolites from the gut lumen to systemic circulation, affecting the metabolism and immune responses in extra-intestinal organs, including altered lipid metabolism and immune cell composition in the liver as well as altered inflammatory phenotype in the eWAT. The expandability of adipocytes in the eWAT is disturbed, resulting in reduced capacity for lipid storage and lipid spill-over to other organs, which subsequently causes increased hepatic lipid accumulation and increased systemic insulin resistance. Alterations in metabolism all over the body are reflected in the urine metabolite profile. Parameters higher in Gliadin+ mice are indicated in red, while parameters lower in Gliadin+ mice are indicated in green.

References

    1. Sapone A. et al.. Spectrum of gluten-related disorders: consensus on new nomenclature and classification. BMC Med. 10, 13 (2012). - PMC - PubMed
    1. Biesiekierski J. R. et al.. Gluten causes gastrointestinal symptoms in subjects without celiac disease: a double-blind randomized placebo-controlled trial. Am. J. Gastroenterol. 106, 508–14 quiz 515 (2011). - PubMed
    1. Vazquez-Roque M. I. et al.. A controlled trial of gluten-free diet in patients with irritable bowel syndrome-diarrhea: effects on bowel frequency and intestinal function. Gastroenterology 144, 903–911.e3 (2013). - PMC - PubMed
    1. Pastore M.-R. et al.. Six months of gluten-free diet do not influence autoantibody titers, but improve insulin secretion in subjects at high risk for type 1 diabetes. J. Clin. Endocrinol. Metab. 88, 162–5 (2003). - PubMed
    1. Hansen C. H. F. et al.. A maternal gluten-free diet reduces inflammation and diabetes incidence in the offspring of NOD mice. Diabetes 63, 2821–32 (2014). - PubMed

Publication types

MeSH terms

LinkOut - more resources