

Trends in Suicide by Level of Urbanization - United States, 1999-2015
- PMID: 28301448
- PMCID: PMC5657870
- DOI: 10.15585/mmwr.mm6610a2
Trends in Suicide by Level of Urbanization - United States, 1999-2015
Abstract
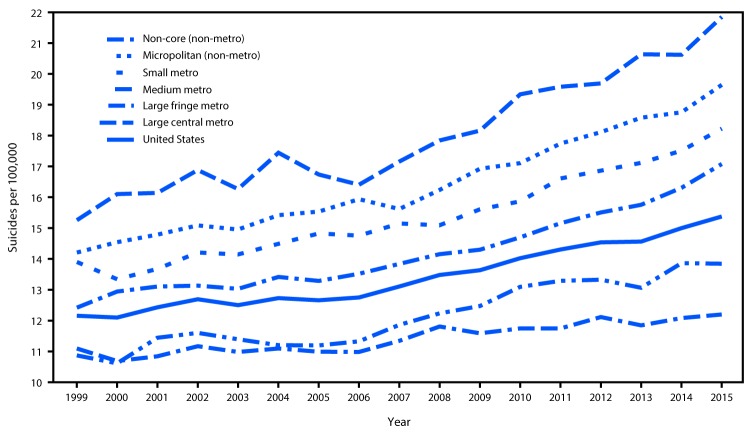
Suicide is a major and continuing public health concern in the United States. During 1999-2015, approximately 600,000 U.S. residents died by suicide, with the highest annual rate occurring in 2015 (1). Annual county-level mortality data from the National Vital Statistics System (NVSS) and annual county-level population data from the U.S. Census Bureau were used to analyze suicide rate trends during 1999-2015, with special emphasis on comparing more urban and less urban areas. U.S. counties were grouped by level of urbanization using a six-level classification scheme. To evaluate rate trends, joinpoint regression methodology was applied to the time-series data for each level of urbanization. Suicide rates significantly increased over the study period for all county groupings and accelerated significantly in 2007-2008 for the medium metro, small metro, and non-metro groupings. Understanding suicide trends by urbanization level can help identify geographic areas of highest risk and focus prevention efforts. Communities can benefit from implementing policies, programs, and practices based on the best available evidence regarding suicide prevention and key risk factors. Many approaches are applicable regardless of urbanization level, whereas certain strategies might be particularly relevant in less urban areas affected by difficult economic conditions, limited access to helping services, and social isolation.
Figures
References
-
- CDC. Web-based Injury Statistics Query and Reporting System (WISQARS). Atlanta, GA: US Department of Health and Human Services, CDC; 2016. https://www.cdc.gov/injury/wisqars/index.html
-
- CDC. Compressed mortality file 1999–2015 on CDC WONDER online database. Atlanta, GA: US Department of Health and Human Services, CDC; 2016. https://wonder.cdc.gov/cmf-icd10.html
-
- Chen LJ, Ingram DD. QuickStats: age-adjusted rates for suicide, by urbanization of county of residence—United States, 2004 and 2013. MMWR Morb Mortal Wkly Rep 2015;64:401.
-
- Health Resources and Services Administration, US Department of Health and Human Services. Designated health professional shortage areas statistics. Washington, DC: US Department of Health and Human Services, Health Resources and Services Administration; 2017. https://datawarehouse.hrsa.gov/topics/shortageAreas.aspx
MeSH terms
LinkOut - more resources
Full Text Sources
Other Literature Sources
Medical
