. 2017 Mar 16;12(3):e0173723.
doi: 10.1371/journal.pone.0173723. eCollection 2017.

Genome-wide mapping of histone H3K9me2 in acute myeloid leukemia reveals large chromosomal domains associated with massive gene silencing and sites of genome instability

Affiliations

Genome-wide mapping of histone H3K9me2 in acute myeloid leukemia reveals large chromosomal domains associated with massive gene silencing and sites of genome instability

Anna C Salzberg et al. PLoS One. .

Abstract

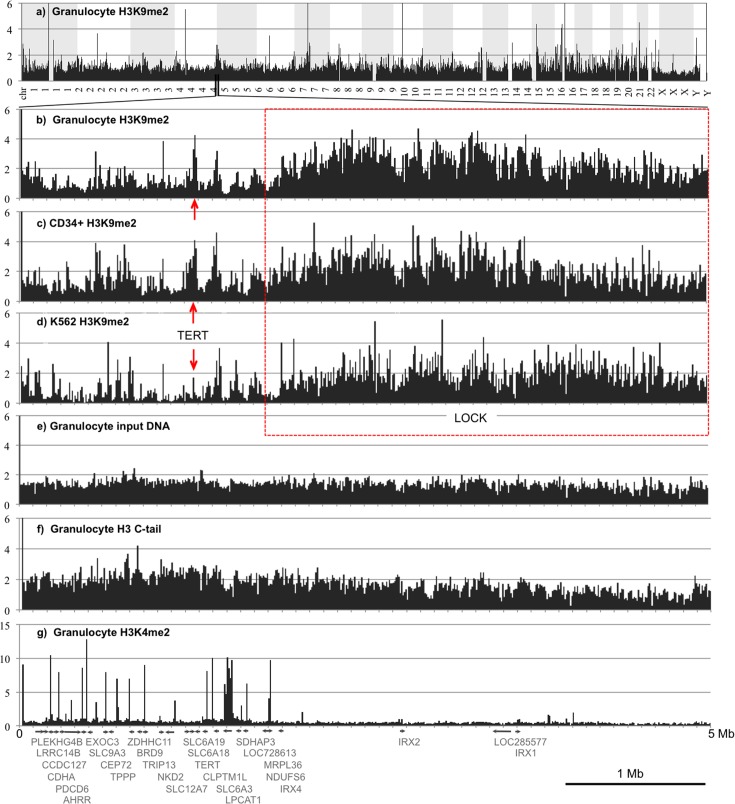
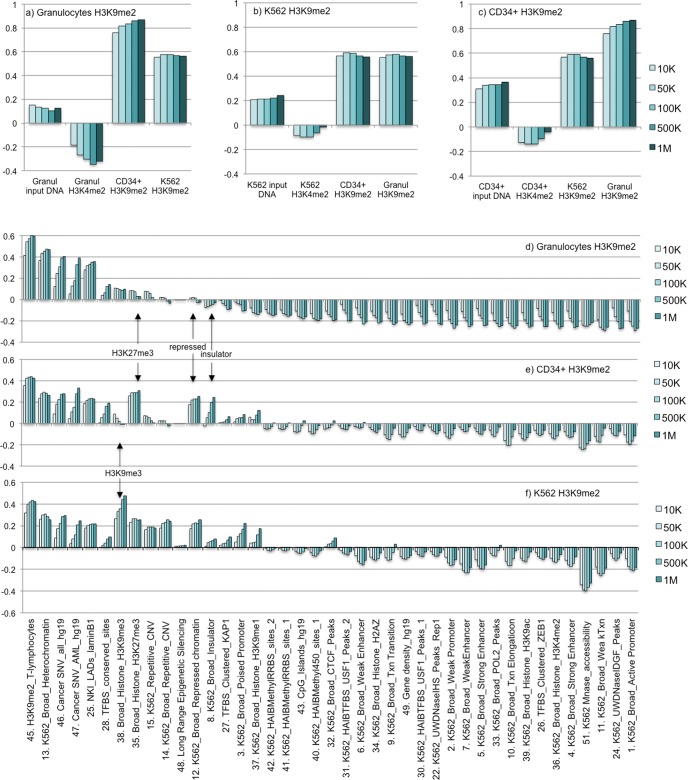
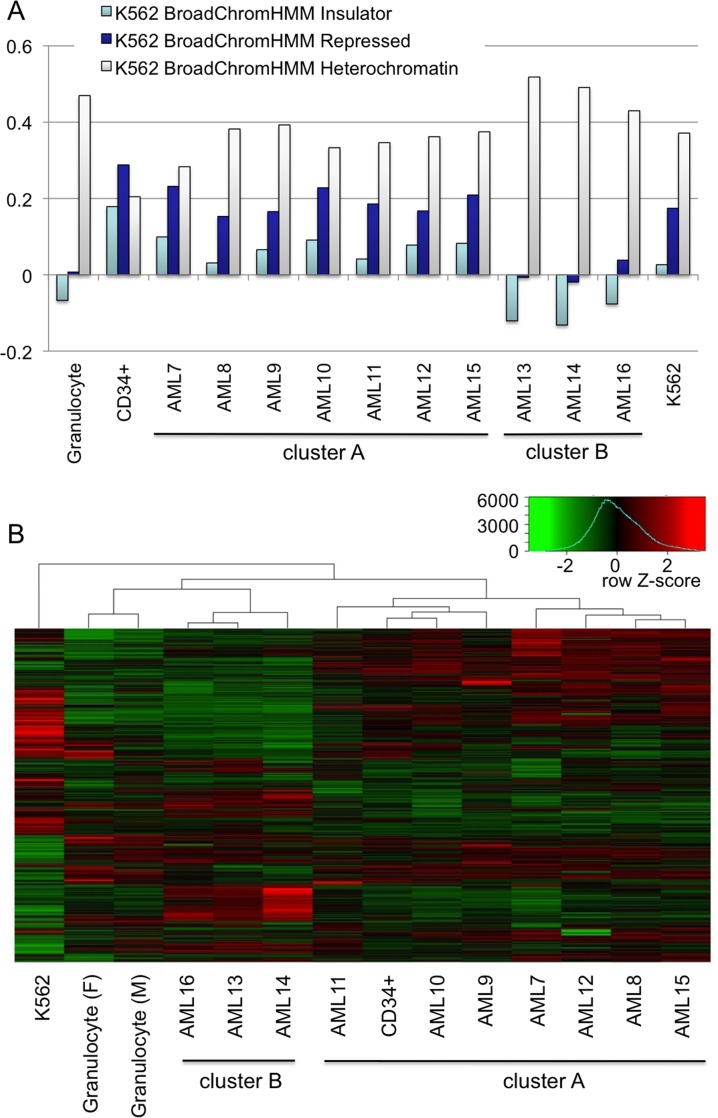
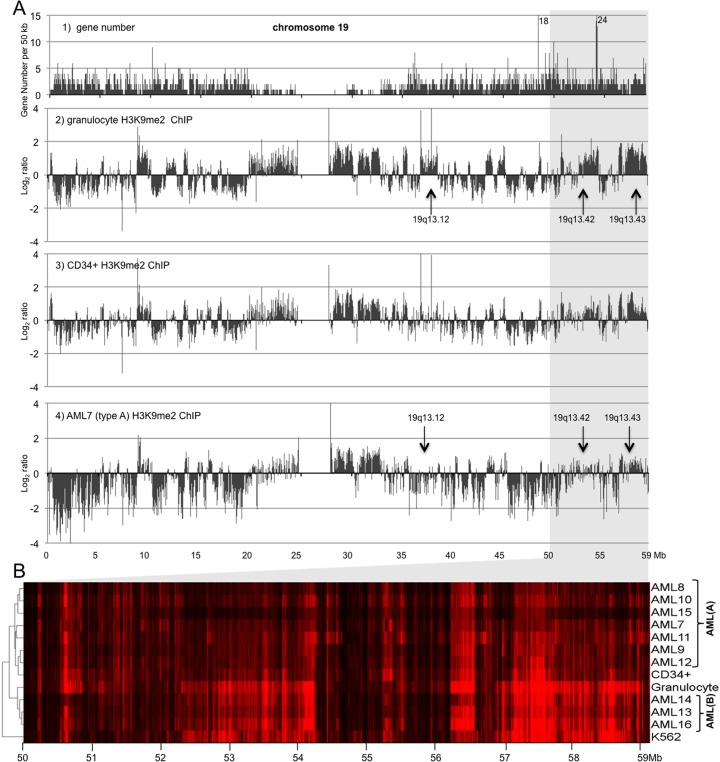
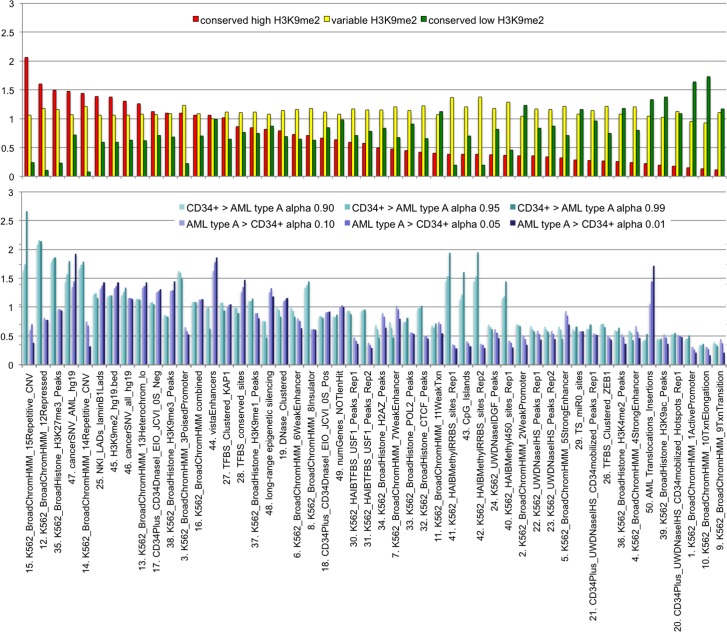
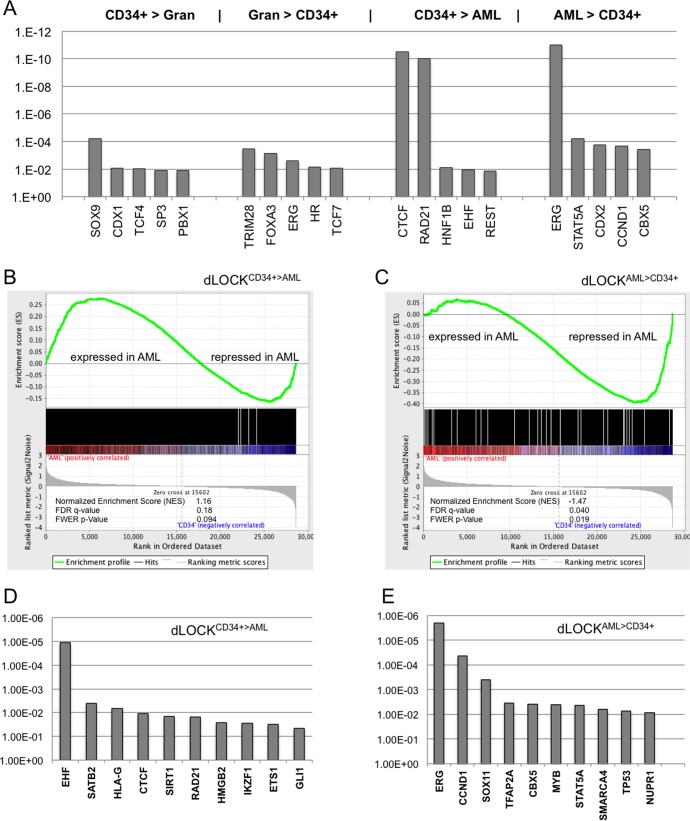
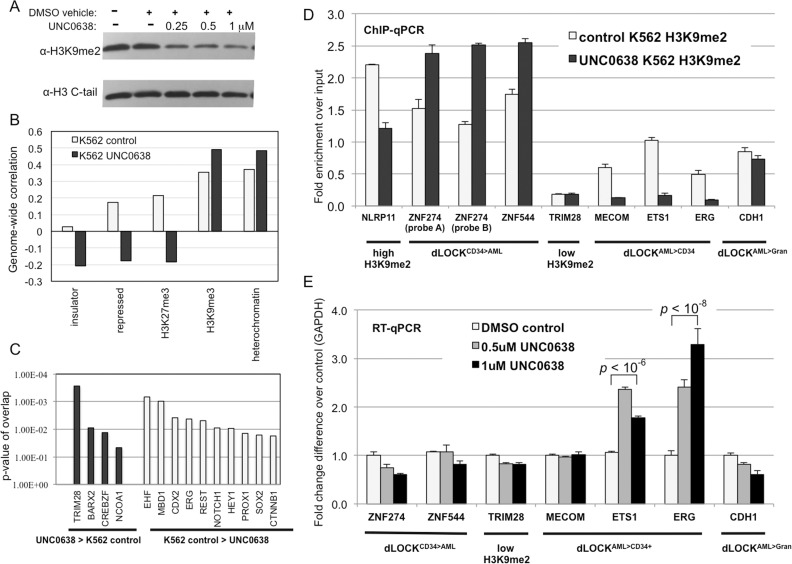
A facultative heterochromatin mark, histone H3 lysine 9 dimethylation (H3K9me2), which is mediated by histone methyltransferases G9a/GLP (EHMT2/1), undergoes dramatic rearrangements during myeloid cell differentiation as observed by chromatin imaging. To determine whether these structural transitions also involve genomic repositioning of H3K9me2, we used ChIP-sequencing to map genome-wide topography of H3K9me2 in normal human granulocytes, normal CD34+ hematopoietic progenitors, primary myeloblasts from acute myeloid leukemia (AML) patients, and a model leukemia cell line K562. We observe that H3K9me2 naturally repositions from the previously designated "repressed" chromatin state in hematopoietic progenitors to predominant association with heterochromatin regions in granulocytes. In contrast, AML cells accumulate H3K9me2 on previously undefined large (> 100 Kb) genomic blocks that are enriched with AML-specific single nucleotide variants, sites of chromosomal translocations, and genes downregulated in AML. Specifically, the AML-specific H3K9me2 blocks are enriched with genes regulated by the proto-oncogene ERG that promotes stem cell characteristics. The AML-enriched H3K9me2 blocks (in contrast to the heterochromatin-associated H3K9me2 blocks enriched in granulocytes) are reduced by pharmacological inhibition of the histone methyltransferase G9a/GLP in K562 cells concomitantly with transcriptional activation of ERG and ETS1 oncogenes. Our data suggest that G9a/GLP mediate formation of transient H3K9me2 blocks that are preserved in AML myeloblasts and may lead to an increased rate of AML-specific mutagenesis and chromosomal translocations.


Conflict of interest statement

Competing Interests: The authors have declared that no competing interests exist.

Figures

Fig 1
Fig 1. Human myeloid cells contain conserved blocks of H3K9me2 at gene-depleted chromosomal regions.
Distribution of DNA sequence reads mapped to the human genome at 1Mb resolution (a) and at 10 kb resolution (showing a region of chromosome 5 between 0 and 5 Mb (b-g). DNA sequence reads were derived from H3K9me2 ChIP-seq of granulocytes sample 15 (a, b), bone marrow CD34+ cells sample 20 (c), K562 cells sample 3 (d); granulocyte input DNA sample 23 (e), granulocyte ChIP-seq of H3 C-tail sample 16 (f), and granulocyte ChIP-seq of H3K4me2 sample 28 (g). The reads were grouped by 10 kb windows and normalized to genome average over the total human genome. Note enrichment of H3K9me2 over a large chromosomal domain, or LOCK [18] indicated by red dashed line box and variable levels of H3K9me2 over the TERT gene forming a peak in the granulocyte and CD34+ cells but not in K562 cells indicated by vertical red arrows. Y-axes represent fold enrichment of sequence reads vs. genome average.
Fig 2
Fig 2. Genome-wide correlation analysis of H3K9me2 domains in myeloid cells.
a-c): graphs showing Pearson correlation values for normal granulocytes (a), K562 (b), and CD34+ H3K9me2 (c) ChIP HMM domains vs: input DNA, H3K4me2 ChIP HMM domains, and H3K9me2 ChIP HMM domains from the two other samples as indicted. The five columns in each sample show correlation values for 10K, 50K, 100K, 500K, and 1M windows (left to right). d-f): graphs show Pearson correlations between granulocyte (d), CD34+ (e), and K562 (f) H3K9me2 HMM domains vs. indicated biodata from human genome-wide databases (for references see Materials and Methods and S4 Table).
Fig 3
Fig 3. Analysis of H3K9me2 correlations in AML cells and identification of two epigenetically different types of AML.
A: Graphs showing correlations between Granulocyte, CD34+ progenitors, 10 AML samples, and K562 H3K9me2 HMM domains vs. selected biodata with top discriminatory power (insulator, repressed chromatin, and heterochromatin). B: Hierarchical cluster analysis of genome-wide H3K9me2 distribution for 10 AML samples, CD34+, granulocytes, and K562 cells. The insert on top shows the color key and histogram for H3K9me2 enrichment/depletion score.
Fig 4
Fig 4. Mapping of H3K9me2 blocks shows consistent alterations associated with myeloid differentiation and AML.
A: 50K resolution maps of chromosome 19 showing gene density (1) and H3K9me2 ChIP-sequence reads (Bowtie) of human granulocytes (2), normal CD34+ cells (3), and AML myeloblasts (4). Sequence reads were normalized to average and plotted in Log2 scale. Red arrows show difference in H3K9me2 levels at three loci at chromosome 19. B: Hierarchical cluster analysis of H3K9me2 distribution over the chromosome 19 (50–59.12 Mb) locus for 10 AML samples, CD34+, granulocytes, and K562 cells.
Fig 5
Fig 5. Major genomic features associated with genes located within H3K9me2 domains altered during myeloid differentiation and AML.
Associations (fold enrichment) of selected genomic features within differential H3K9me2 domains altered in myeloid cells. The top panel shows: domains of constant high (red) variable (yellow) and constant low (green) H3K9me2 in all myeloid cells; The bottom panel shows: H3K9me2 dLOCKs maximal and minimal in CD34+ vs. AML cluster A. Data in the top panel are based on dLOCKs at alpha>0.90, 0.95, 0.99 and dLOCKs at alpha<0.10, 0.05, 0.01). Data in the bottom panel are based on dLOCKs at alpha >0.95 and <0.05. For references (as numbered) see Materials and Methods and S6 Table).
Fig 6
Fig 6. Genes within the transient H3K9me2 blocks are controlled by specific upstream regulators and undergo massive transcriptional changes in AML.
A: Top upstream transcriptional regulators associated with total genes within the four types of dLOCKs (a>0.95; a<0.05) shown at the top. B, C: Gene set enrichment analysis [64] with AML and CD34+ control cell populations reveals contrasting association of the H3K9me2 dLOCKCD34+>AML (B) and AML-repressed genes within dLOCKAML>CD34+ (C) with genes up- and down-regulated in AML. D, E: Top upstream regulators associated with the AML-expressed genes within dLOCKCD34+>AML (D) and AML-repressed genes within dLOCKAML>CD34+ (E).
Fig 7
Fig 7. Inhibition of G9a/GLP in K562 decreases H3K9me2 levels and activates genes within AML-enriched transient H3K9me2 blocks.
A: Western blotting probed with antibodies against H3K9me2 and unmodified histone H3 show decreasing levels of H3K9me2 in K562 cells treated with G9a/GLP inhibitor UNC0638. B: Graphs showing correlations between H3K9me2 domains in control and 1 μM UNC0638-treated K562 cells vs. selected biodata with top discriminatory power (insulator, repressed chromatin, H3K27me3, H3K9me3, and heterochromatin). C: Ingenuity pathway analysis showing upstream regulators associated with the dLOCKUNC0638>K562control and dLOCKK562control>UNC0638. D: H3K9me2 levels determined by ChIP-qPCR in control and UNC0638-treated K562 cells for selected gene probes representing dLOCKCD34+>AML (ZNF274, ZNF544), constitutively high H3K9me2 (NLRP11), constitutively low H3K9me2 (TRIM28), dLOCKAML>CD34+ (MECOM, ETS1, ERG) and dLOCKAML>Gran (CDH1). E: RT-PCR analysis of gene expression level in control and UNC0638-treated K562 cells for selected gene probes representing dLOCKCD34+>AML (ZNF274, ZNF544), constitutively low H3K9me2 (TRIM28), dLOCKAML>CD34+ (MECOM, ETS1, ERG) and dLOCKAML>Gran (CDH1). p–values represent Student’s t-test for 2 tailed, unpaired equal variance.
Fig 8
Fig 8. A proposed role of the transient blocks of H3K9me2 in transcriptional repression and chromosomal instability in myeloid leukemia.
During normal myeloid differentiation, H3K9me2 marks (red stars) accumulate on heterochromatic chromosomal domains (black) that, together with developmentally- repressed facultative heterochromatin (orange) form condensed heterochromatin blocks (curved lines). At the onset of myeloid leukemia, the transitional blocks of H3K9me2 containing proto-oncogenes involved in stem cell maintenance in CD34+ progenitors (orange) accumulate H3K9me2 and become transcriptionally silenced. These transitional blocks are prone to increased mutagenesis and chromosomal translocations. The proto-oncogenes within the H3K9me2 blocks are likely to become reactivated as a result of the boundary site mutations or chromosomal translocations disrupting the chromatin boundaries (blue ovals) between the inactive and constitutively active (green) domains and leading to more aggressive forms of acute myeloid leukemia.

References

    1. Richmond TJ, Davey CA. The structure of DNA in the nucleosome core. Nature. 2003;423(6936):145–50. 10.1038/nature01595 - DOI - PubMed
    1. Kornberg RD, Lorch Y. Chromatin rules. Nat Struct Mol Biol. 2007;14(11):986–8.
    1. Berger SL, Kouzarides T, Shiekhattar R, Shilatifard A. An operational definition of epigenetics. Genes Dev. 2009;23(7):781–3. 10.1101/gad.1787609 - DOI - PMC - PubMed
    1. Sridharan R, Gonzales-Cope M, Chronis C, Bonora G, McKee R, Huang C, et al. Proteomic and genomic approaches reveal critical functions of H3K9 methylation and heterochromatin protein-1gamma in reprogramming to pluripotency. Nature cell biology. 2013;15(7):872–82. Epub 2013/06/12. 10.1038/ncb2768 - DOI - PMC - PubMed
    1. Timp W, Feinberg AP. Cancer as a dysregulated epigenome allowing cellular growth advantage at the expense of the host. Nature reviews Cancer. 2013;13(7):497–510. Epub 2013/06/14. 10.1038/nrc3486 - DOI - PMC - PubMed