MicroRNA-142 regulates inflammation and T cell differentiation in an animal model of multiple sclerosis
- PMID: 28302134
- PMCID: PMC5356264
- DOI: 10.1186/s12974-017-0832-7
MicroRNA-142 regulates inflammation and T cell differentiation in an animal model of multiple sclerosis
Abstract
Background: MicroRNAs have emerged as an important class of modulators of gene expression. These molecules influence protein synthesis through translational repression or degradation of mRNA transcripts. Herein, we investigated the potential role of miR-142a isoforms, miR-142a-3p and miR-142a-5p, in the context of autoimmune neuroinflammation.
Methods: The expression levels of two mature isoforms of miR-142 were measured in the brains of patients with multiple sclerosis (MS) and the CNS tissues from mice with experimental autoimmune encephalomyelitis (EAE), an animal model of MS. Expression analyses were also performed in mitogen and antigen-stimulated splenocytes, as well as macrophages and astrocytes using real-time RT-PCR. The role of the mature miRNAs was then investigated in T cell differentiation by transfection of CD4+ T cells, followed by flow cytometric analysis of intracellular cytokines. Luciferase assays using vectors containing the 3'UTR of predicted targets were performed to confirm the interaction of miRNA sequences with transcripts. Expression of targets were then analyzed in activated splenocytes and MS/EAE tissues.
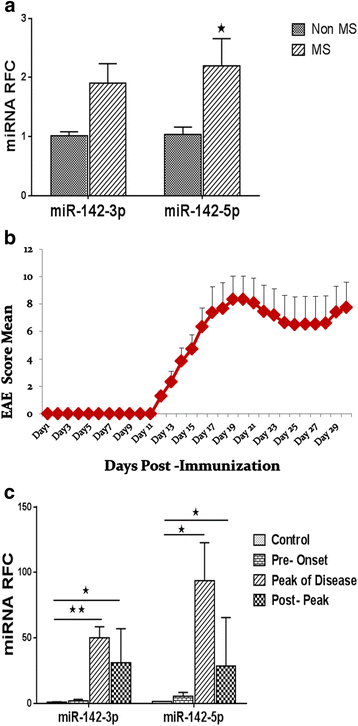
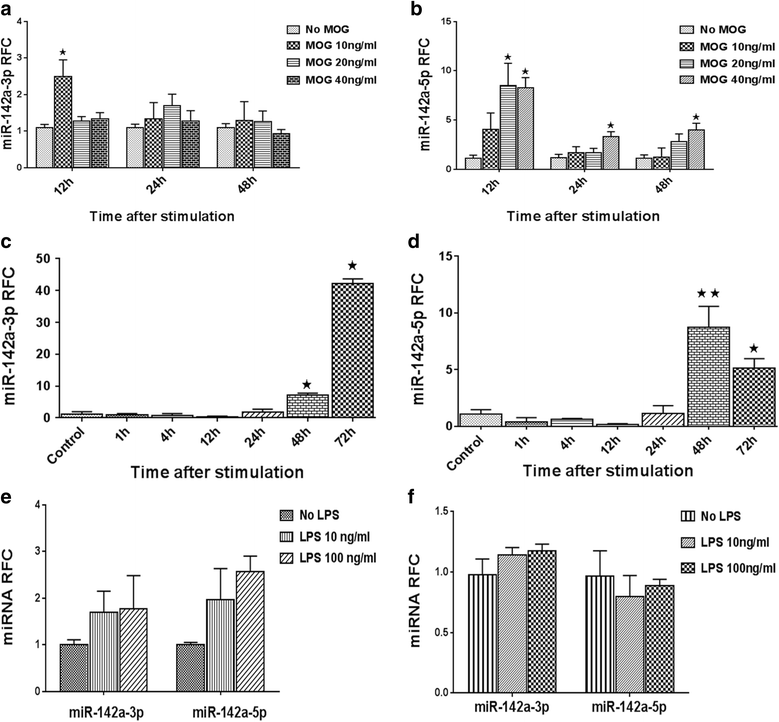
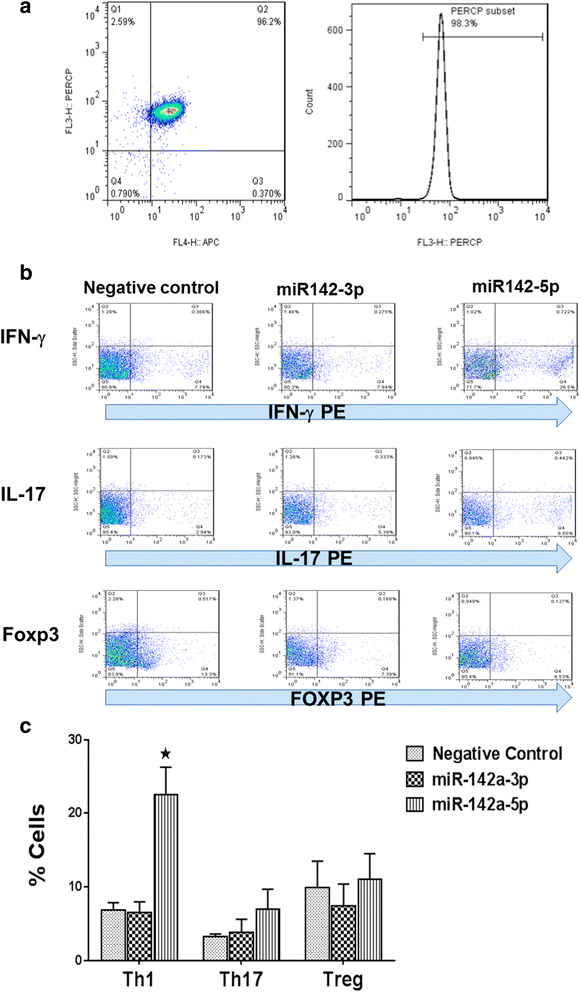
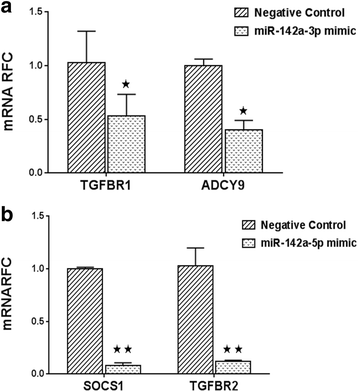
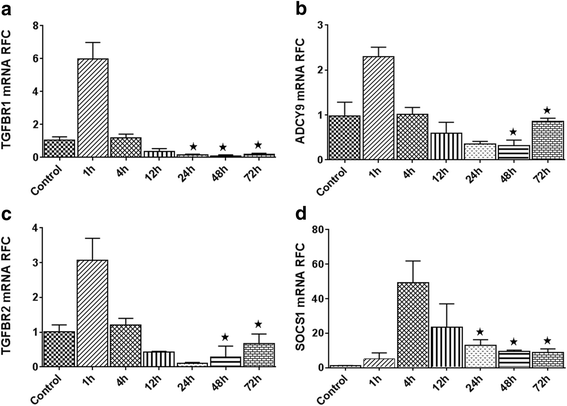
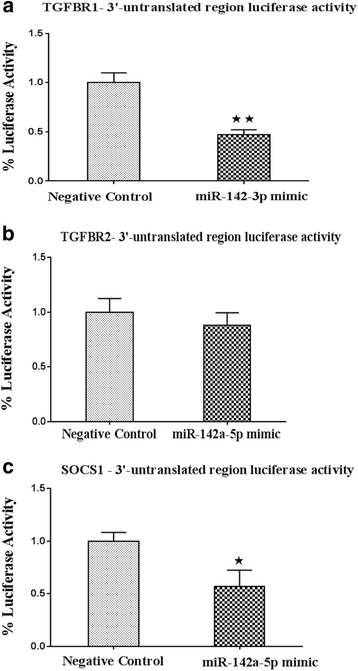
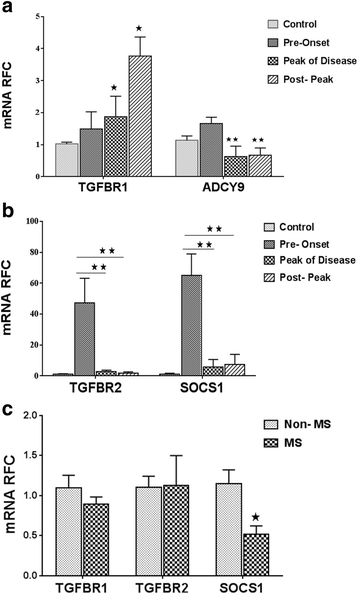
Results: Expression of miR-142-5p was significantly increased in the frontal white matter from MS patients compared with white matter from non-MS controls. Likewise, expression levels of miR-142a-5p and miR-142a-3p showed significant upregulation in the spinal cords of EAE mice at days 15 and 25 post disease induction. Splenocytes stimulated with myelin oligodendrocyte glycoprotein (MOG) peptide or anti-CD3/anti-CD28 antibodies showed upregulation of miR-142a-5p and miR-142a-3p isoforms, whereas stimulated bone marrow-derived macrophages and primary astrocytes did not show any significant changes in miRNA expression levels. miR-142a-5p overexpression in activated lymphocytes shifted the pattern of T cell differentiation towards Th1 cells. Luciferase assays revealed SOCS1 and TGFBR1 as direct targets of miR-142a-5p and miR-142a-3p, respectively, and overexpression of miRNA mimic sequences suppressed the expression of these target transcripts in lymphocytes. SOCS1 levels were also diminished in MS white matter and EAE spinal cords.
Conclusions: Our findings suggest that increased expression of miR-142 isoforms might be involved in the pathogenesis of autoimmune neuroinflammation by influencing T cell differentiation, and this effect could be mediated by interaction of miR-142 isoforms with SOCS1 and TGFBR-1 transcripts.
Keywords: Experimental autoimmune encephalomyelitis; MicroRNA; Multiple sclerosis; Neuroinflammation; T cell differentiation.
Figures
Similar articles
-
Inflammation in an Animal Model of Multiple Sclerosis Leads to MicroRNA-25-3p Dysregulation Associated with Inhibition of Pten and Klf4.Iran J Allergy Asthma Immunol. 2021 Jun 6;20(3):314-325. doi: 10.18502/ijaai.v20i3.6337. Iran J Allergy Asthma Immunol. 2021. PMID: 34134453
-
RGS10 deficiency ameliorates the severity of disease in experimental autoimmune encephalomyelitis.J Neuroinflammation. 2016 Feb 1;13:24. doi: 10.1186/s12974-016-0491-0. J Neuroinflammation. 2016. PMID: 26831924 Free PMC article.
-
T cell-depleted splenocytes from mice pre-immunized with neuroantigen in incomplete Freund's adjuvant involved in protection from experimental autoimmune encephalomyelitis.Immunol Lett. 2014 Jan-Feb;157(1-2):38-44. doi: 10.1016/j.imlet.2013.11.001. Epub 2013 Nov 9. Immunol Lett. 2014. PMID: 24220208
-
Regulation of the MIR155 host gene in physiological and pathological processes.Gene. 2013 Dec 10;532(1):1-12. doi: 10.1016/j.gene.2012.12.009. Epub 2012 Dec 14. Gene. 2013. PMID: 23246696 Review.
-
Glutamate, T cells and multiple sclerosis.J Neural Transm (Vienna). 2017 Jul;124(7):775-798. doi: 10.1007/s00702-016-1661-z. Epub 2017 Feb 24. J Neural Transm (Vienna). 2017. PMID: 28236206 Review.
Cited by
-
MicroRNA-92a Drives Th1 Responses in the Experimental Autoimmune Encephalomyelitis.Inflammation. 2019 Feb;42(1):235-245. doi: 10.1007/s10753-018-0887-3. Inflammation. 2019. PMID: 30411211
-
Plasma microRNA Profiles as a Potential Biomarker in Differentiating Adult-Onset Still's Disease From Sepsis.Front Immunol. 2019 Jan 11;9:3099. doi: 10.3389/fimmu.2018.03099. eCollection 2018. Front Immunol. 2019. PMID: 30687316 Free PMC article.
-
Environmental Influencers, MicroRNA, and Multiple Sclerosis.J Cent Nerv Syst Dis. 2020 Jan 20;12:1179573519894955. doi: 10.1177/1179573519894955. eCollection 2020. J Cent Nerv Syst Dis. 2020. PMID: 32009827 Free PMC article. Review.
-
Potential involvement of circulating extracellular vesicles and particles on exercise effects in malignancies.Front Endocrinol (Lausanne). 2023 Mar 3;14:1121390. doi: 10.3389/fendo.2023.1121390. eCollection 2023. Front Endocrinol (Lausanne). 2023. PMID: 36936170 Free PMC article. Review.
-
miR-142 induces accumulation of reactive oxygen species (ROS) by inhibiting pexophagy in aged bone marrow mesenchymal stem cells.Sci Rep. 2020 Feb 28;10(1):3735. doi: 10.1038/s41598-020-60346-2. Sci Rep. 2020. PMID: 32111926 Free PMC article.
References
Publication types
MeSH terms
Substances
LinkOut - more resources
Full Text Sources
Other Literature Sources
Medical
Research Materials

