. 2017 May-Jun;23(3):187-193.
doi: 10.5152/dir.2016.16255.

Spectral detector CT for cardiovascular applications

Affiliations

Spectral detector CT for cardiovascular applications

Prabhakar Rajiah et al. Diagn Interv Radiol. 2017 May-Jun.

Abstract

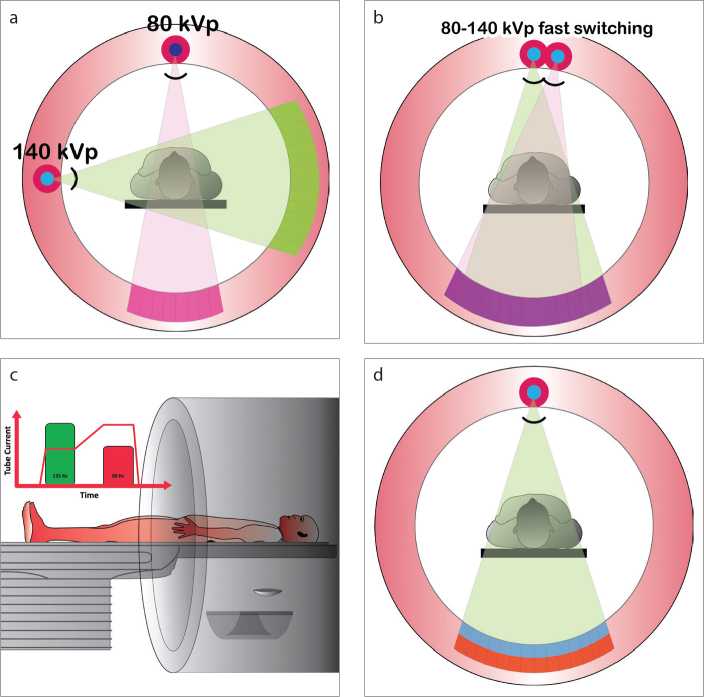
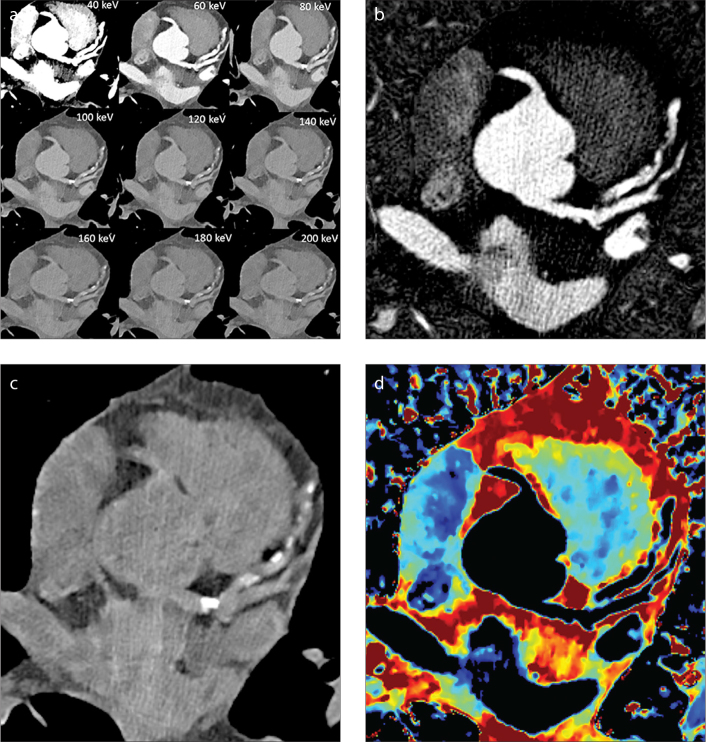
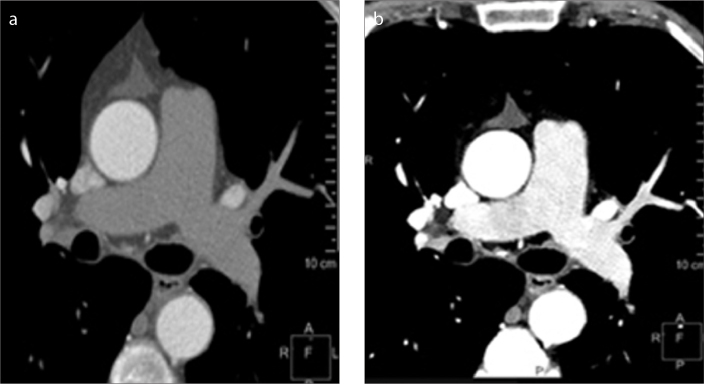
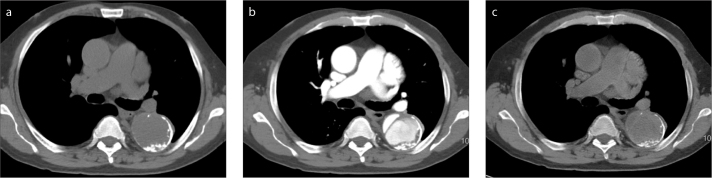
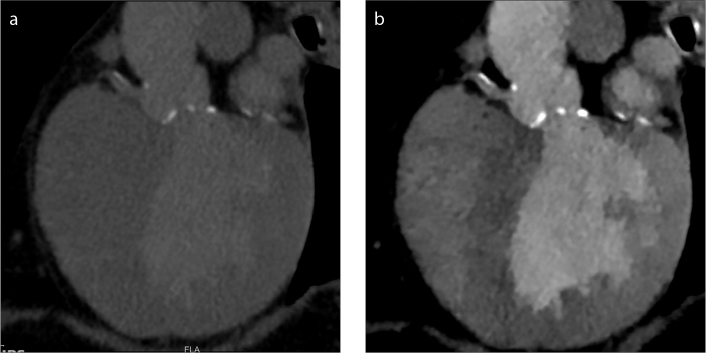
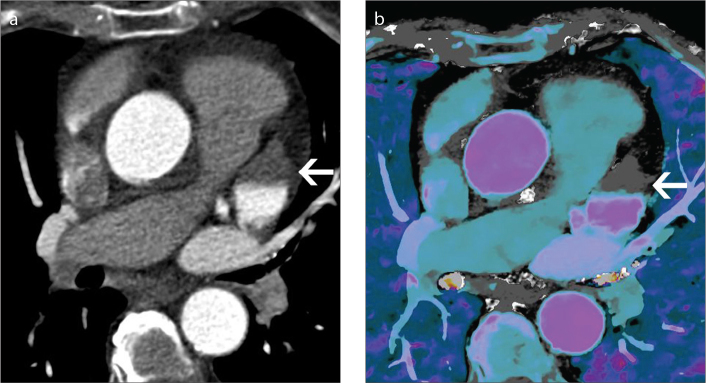
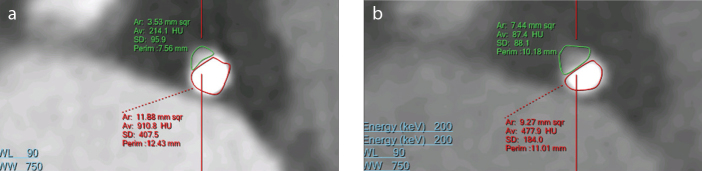
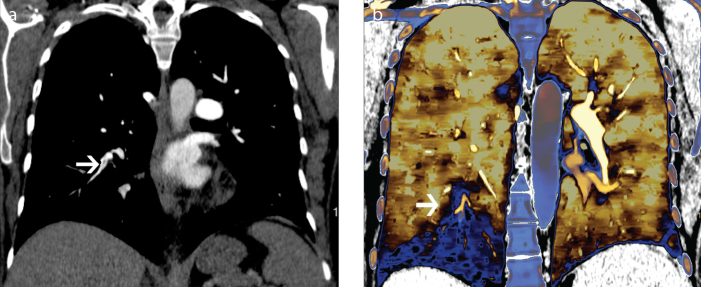
Spectral detector computed tomography (SDCT) is a novel technology that uses two layers of detectors to simultaneously collect low and high energy data. Spectral data is used to generate conventional polyenergetic images as well as dedicated spectral images including virtual monoenergetic and material composition (iodine-only, virtual unenhanced, effective atomic number) images. This paper provides an overview of SDCT technology and a description of some spectral image types. The potential utility of SDCT for cardiovascular imaging and the impact of this new technology on radiation and contrast dose are discussed through presentation of initial patient studies performed on a SDCT scanner. The value of SDCT for salvaging suboptimal studies including those with poor contrast-enhancement or beam hardening artifacts through retrospective reconstruction of spectral data is discussed. Additionally, examples of specific benefits for the evaluation of aortic disease, imaging before transcatheter aortic valve implantation, evaluation of pulmonary veins pre- and post-pulmonary radiofrequency ablation, evaluation of coronary artery lumen, assessment of myocardial perfusion, detection of pulmonary embolism, and characterization of incidental findings are presented.


Conflict of interest statement

Conflict of interest disclosure

Prabhakar Rajiah has received institutional research support and honoraria from Philips Healthcare. Suhny Abbara has received institutional research support from Philips Healthcare. Sandra Halliburton is a Philips Healthcare employee.

Figures

Figure 1. a–d
Figure 1. a–d
Illustration showing different types of dual energy CT scanners. Dual source scanner (a): in this type of technology, there are two x-ray sources, which are operated at different energies (for example, 80 and 140 kVp). Rapid kVp switching (b): at each x-ray projection, the kVp is rapidly switched between low (80 kVp) and high energy (140 kVp) levels. Dual spin technology (c): using a volume scanner, the patient is initially scanned at one energy level (135 kVp) and immediately scanned in the same anatomic location using a different energy level (80 kVp). Dual layer or spectral detector CT (SDCT) (d): in this technology, there is one x-ray source, but there are two layers of detectors, with the top layer (blue) absorbing low energy photons and the bottom layer (red) absorbing high energy photons.
Figure 2. a–d
Figure 2. a–d
Types of spectral images. Panel (a) shows cross-section of the heart displayed as virtual monoenergetic images from 40 to 200 keV displaying tissue attenuation properties similar to those resulting from imaging with a monoenergetic beam at a single keV level. Panel (b) shows iodine density maps in which pixels containing iodine are preserved but all other pixels appear black. Panel (c) displays virtual unenhanced images in which pixels containing iodine have been removed. Panel (d) shows effective atomic number (Zeffective) images; pixel values equal Zeffective of tissue contained within each voxel.
Figure 3. a, b
Figure 3. a, b
Salvage of a suboptimal pulmonary embolism study. Conventional polyenergetic CT image (a) obtained for evaluation of pulmonary embolism with poor vascular enhancement due to contrast extravasation. Virtual 40 keV monoenergetic image (b) shows significantly improved enhancement permitting evaluation of the pulmonary arteries, obviating the need for a repeat contrast injection.
Figure 4. a–c
Figure 4. a–c
Equivalency of virtual unenhanced image to true unenhanced image in patient evaluated for acute chest pain. Conventional polyenergetic axial CT image of the chest (a) obtained before the injection of contrast showing no contrast in the aorta and other vascular structures. Conventional contrast-enhanced image (b) obtained just after contrast injection showing increased attenuation in the aorta. Virtual unenhanced image (c) created from spectral data obtained just after contrast injection. Like the true unenhanced image at approximately the same level, the virtual unenhanced image shows no contrast in the aorta and other vascular structures.
Figure 5. a, b
Figure 5. a, b
Administration of low volume of contrast in a patient imaged for evaluation prior to percutaneous aortic valvular implantation. Conventional polyenergetic CT image (a) in a patient after injection of 20 mL of iodinated contrast shows suboptimal blood pool enhancement. Virtual 40 keV monoenergetic image (b) generated from the same data set at the same level shows significant boosting of contrast within the vessels.
Figure 6. a, b
Figure 6. a, b
Distinguishing thrombus and slow flow in a patient referred for pulmonary vein evaluation. Conventional polyenergetic 120 kVp axial CT image (a) shows a hypoattenuating lesion in the left atrial appendage (arrow) with a mean attenuation of 65 HU which is indeterminate for discriminating thrombus from slow flow. Iodine overlay at the same level shows no significant iodine (0.5 mg/mL) in the lesion (arrow) indicating lesion is a thrombus
Figure 7. a, b
Figure 7. a, b
Reduction in calcium blooming artifact in a patient imaged for atypical chest pain. Conventional polyenergetic CT image (a) shows significant calcium blooming in coronary artery, with luminal area of 3.5 mm2. Panel (b) shows 160 keV image with reduced blooming and better defined lumen with area of 7.4 mm2.
Figure 8. a, b
Figure 8. a, b
Perfusion defect from pulmonary embolism. CT pulmonary angiogram (a) shows a subtle filling defect in a segmental branch of right lower lobe (arrow). Effective atomic number overlay on conventional image (b) shows a peripheral wedge shaped perfusion defect in the right lower lobe (arrow), a consequence of a subtle chronic pulmonary embolism.

Similar articles

Cited by

References

    1. Johnson TRC. Dual-energy CT: General principles. Am J Roentgenol. 2012;199:S3–8. https://doi.org/10.2214/AJR.12.9116. - DOI - PubMed
    1. Goodsitt MM, Christodoulou EG, Larson SC. Accuracies of the synthesized monochromatic CT numbers and effective atomic numbers obtained with a rapid kVp switching dual energy CT scanner. Med Phys. 2011;38:2222–2232. https://doi.org/10.1118/1.3567509. - DOI - PubMed
    1. Yu L, Leng S, McCollough CH. Dual-source multi-energy CT with triple or quadruple X-ray beams. Proc SPIE Int Soc Opt Eng. 2016;9783:978312. - PMC - PubMed
    1. Alvarez RE, Macovski A. Energy-selective reconstructions in X-ray computerized tomography. Phys Med Biol. 1976;21:633–644. https://doi.org/10.1088/0031-9155/21/5/002. - DOI - PubMed
    1. Vlahos I, Chung R, Nair A, Morgan R. Dual-energy CT: vascular applications. Am J Roentgenol. 2012;199:S87–97. https://doi.org/10.2214/AJR.12.9114. - DOI - PubMed

MeSH terms