. 2017 Apr 3;214(4):895-904.
doi: 10.1084/jem.20160801. Epub 2017 Mar 16.

PD-L1 on tumor cells is sufficient for immune evasion in immunogenic tumors and inhibits CD8 T cell cytotoxicity

Affiliations

PD-L1 on tumor cells is sufficient for immune evasion in immunogenic tumors and inhibits CD8 T cell cytotoxicity

Vikram R Juneja et al. J Exp Med. .

Abstract

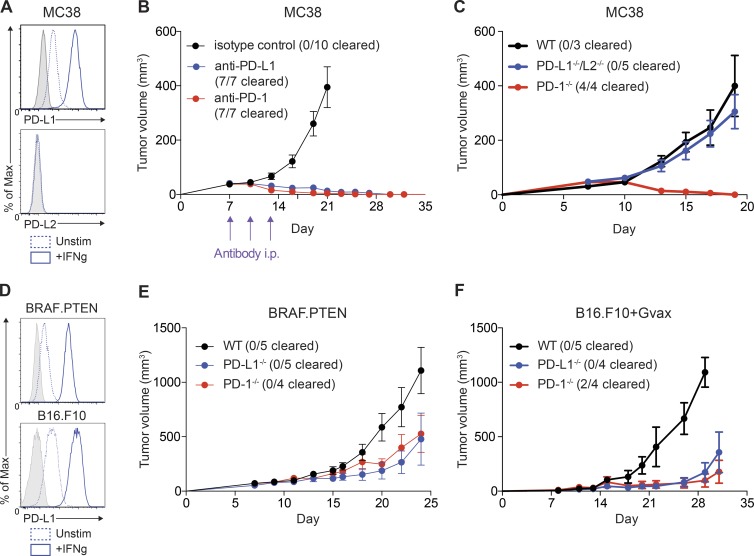
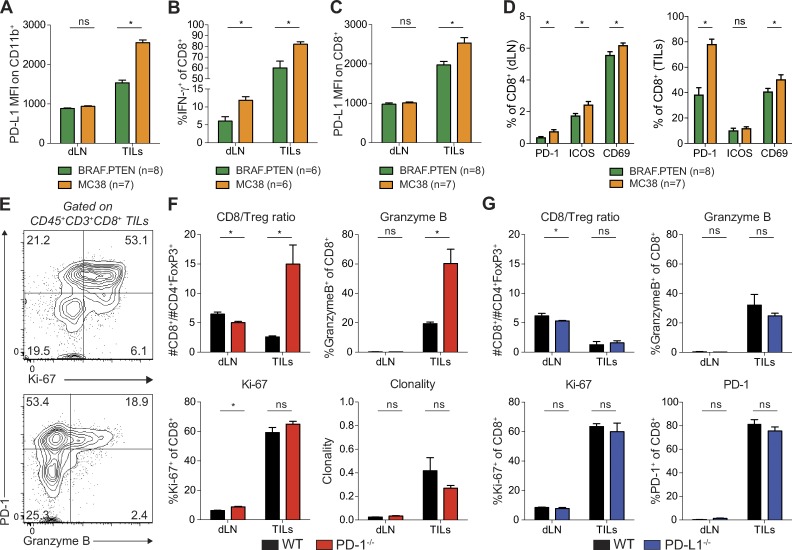
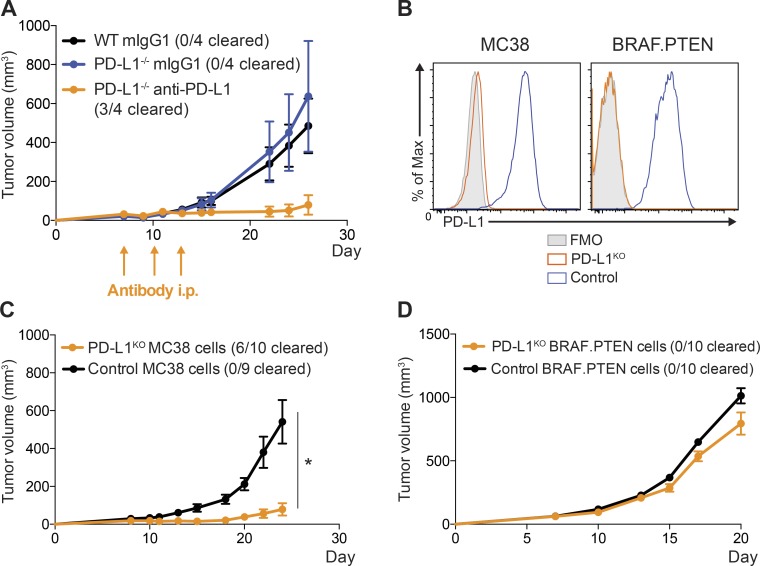
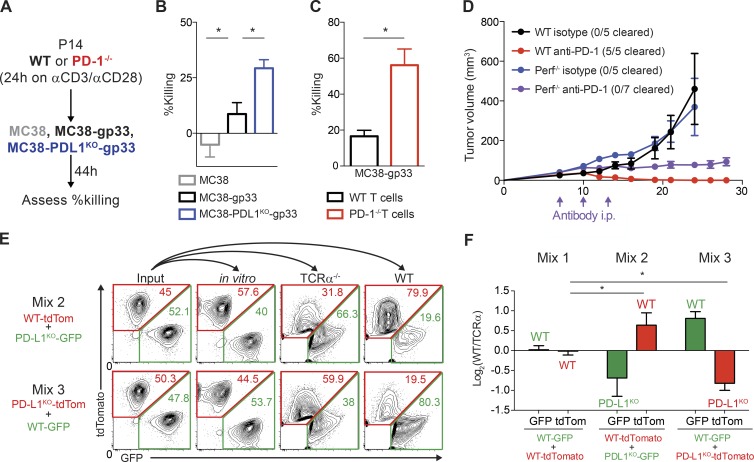
It is unclear whether PD-L1 on tumor cells is sufficient for tumor immune evasion or simply correlates with an inflamed tumor microenvironment. We used three mouse tumor models sensitive to PD-1 blockade to evaluate the significance of PD-L1 on tumor versus nontumor cells. PD-L1 on nontumor cells is critical for inhibiting antitumor immunity in B16 melanoma and a genetically engineered melanoma. In contrast, PD-L1 on MC38 colorectal adenocarcinoma cells is sufficient to suppress antitumor immunity, as deletion of PD-L1 on highly immunogenic MC38 tumor cells allows effective antitumor immunity. MC38-derived PD-L1 potently inhibited CD8+ T cell cytotoxicity. Wild-type MC38 cells outcompeted PD-L1-deleted MC38 cells in vivo, demonstrating tumor PD-L1 confers a selective advantage. Thus, both tumor- and host-derived PD-L1 can play critical roles in immunosuppression. Differences in tumor immunogenicity appear to underlie their relative importance. Our findings establish reduced cytotoxicity as a key mechanism by which tumor PD-L1 suppresses antitumor immunity and demonstrate that tumor PD-L1 is not just a marker of suppressed antitumor immunity.


Figures

Figure 1.
Figure 1.
Relative role of PD-L1 on tumor cells differs by model. (A) MC38 tumor cells were cultured in vitro and stimulated with IFN-γ (20 ng/ml) for 24 h. Expression of PD-L1 and PD-L2 was assessed by flow cytometry. FMO staining control shown in gray. (B) WT mice were given 105 MC38 tumor cells s.c. and treated on days 7, 10, and 13 with (red) anti–PD-1 (29F.1A12; 29/30 mice cleared tumors across all experiments) or (black) isotype control (rIgG2a; n = 5), or (blue) anti–PD-1 (339.6A2; 20/30 mice cleared tumors across all experiments) or isotype control (mIgG1; n = 5). Tumors were measured every 2–3 d starting on day 7. Control treated tumors had equivalent growth curves and were pooled for plotting purposes. Tumor growth is representative of five independent experiments with at least five mice per group. (C) WT, PD-1−/−, or PD-L1−/−/L2−/− mice were given 105 MC38 tumor cells s.c. Tumors were measured every 2–3 d starting on day 7. Tumor growth is representative of five independent experiments with at least five mice per group. (D) BRAF.PTEN melanoma cells and B16.F10 melanoma cells were cultured in vitro and stimulated with IFN-γ (20 ng/ml) for 24 h. Expression of PD-L1 was assessed by flow cytometry. FMO staining control is shown in gray. Expression representative of three independent experiments where n = 3. (E) WT, PD-1−/−, or PD-L1−/−/L2−/− mice were given 105 BRAF.PTEN tumor cells s.c. Tumors were measured every 2–3 d starting on day 7. Tumor growth is representative of three independent experiments with at least five mice per group. (F) WT, PD-1−/−, or PD-L1−/−/L2−/− mice were given 105 B16.F10 tumor cells s.c. and 106 irradiated B16/GM-CSF tumor cells s.c. on the contralateral side. Tumors were measured every 2–3 d starting on day 7. Tumor growth is representative of three independent experiments with at least five mice per group.
Figure 2.
Figure 2.
PD-L1 on MC38 tumor cells directly suppresses CD8 TILs. (A–D) Cells were isolated from the draining LN (dLN) or tumor (tumor infiltrating leukocytes; TILs) on day 20 of MC38 or BRAF.PTEN tumor growth and analyzed by flow cytometry. Analysis representative of two independent with at least six mice per group as indicated under each plot. Statistical significance determined by Student’s t test where P < 0.05 (* indicates significance; ns, not significant). (A) Expression of PD-L1 on CD45+CD11b+ myeloid cells analyzed directly ex vivo. (B) Expression of IFN-γ in CD8+ T cells after ex vivo restimulation. Gating is based on unstimulated control. (C) Expression of PD-L1 on CD8+ T cells analyzed directly ex vivo. (D) Expression of PD-1, ICOS, and CD69 on CD8+ T cells analyzed directly ex vivo. (E) CD45+CD3+CD8+ live cells were isolated from the tumor of WT mice on day 10 of tumor growth and analyzed by flow cytometry directly ex vivo. Representative plots showing expression of PD-1, and Granzyme B or Ki-67 on TILs from WT mice where the numbers within each quadrant represent the frequency of each population. (F and G) Cells were isolated from the dLN or tumor (tumor infiltrating lymphocytes; TILs) on day 10 of tumor growth and analyzed by flow cytometry directly ex vivo. Statistical significance determined by Student’s t test, where P < 0.05 (* indicates significance; ns, not significant). (F) TIL analyses from WT and PD-1−/− mice. The ratio of CD8+ T cells to CD4+FoxP3+ cells (CD8/T reg), percentage of cells expressing Ki-67 or Granzyme B, and the clonality of CD8+ T cells were compared in tumors from WT and PD-1−/− mice. (G) TIL analyses from WT and PD-L1−/− mice. The ratio of CD8+ T cells to CD4+FoxP3+ cells (CD8/T reg), percentage of cells expressing Ki-67, PD-1, or Granzyme B were compared in tumors from WT and PD-L1−/− mice. Clonality calculation is from one experiment.
Figure 3.
Figure 3.
PD-L1 on MC38 tumor cells is critical for suppression of antitumor immunity. (A) WT or PD-L1−/− mice were given 105 MC38 tumor cells s.c. and treated on days 7, 10, and 13 with anti–PD-1 (339.6A2) or isotype control (mIgG1). Tumors were measured every 2–3 d starting on day 7. (B) Control MC38 and MC38 PD-L1KO (left) or control BRAF.PTEN and BRAF.PTEN PD-L1KO (right) cells were cultured in vitro and stimulated with IFN-γ (20 ng/ml) for 24 h. Expression of PD-L1 was assessed by flow cytometry. (C) WT mice were given either 105 control MC38 or MC38 PD-L1KO tumor cells s.c. and tumors measured every 2–3 d, starting on day 7. (D) WT mice were given either 105 control BRAF.PTEN or PD-L1KO BRAF.PTEN tumor cells s.c., and tumors were measured every 2–3 d starting on day 7. Tumor growth experiments are representative of at least two independent experiments (n = 4–10 mice per group, as indicated). Statistical significance determined by Student’s t test, where P < 0.05 (* indicates significance).
Figure 4.
Figure 4.
PD-L1 on MC38 tumor cells directly suppresses cytotoxicity of CD8+ T cells. (A) Experimental schema for B and C. P14 TCR Tg T cells were isolated and stimulated with anti-CD3/CD28 for 24 h, and then cultured with the indicated MC38 cells for 44 h. Tumor cell killing represents percentage reduction in number of tumor cells with T cells relative to control cultures without T cells. All experiments were performed with four biological replicates per group and are representative of at least two independent experiments. (B) Relative killing by WT T cells of MC38 control cells, MC38 cells expressing the gp33 antigen (MC38-gp33), and MC38-gp33 cells deficient for PD-L1. Statistical significance determined by Student’s t test where P < 0.05 (* indicates significance). (C) Relative killing of MC38-gp33 by WT versus PD-1–deficient T cells. Statistical significance determined by Student’s t test where P < 0.05 (* indicates significance). (D) WT or Perforin−/− mice were given 105 MC38 tumor cells s.c. and treated on days 7, 10, and 13 with anti–PD-1 (339.6A2) or isotype control (mIgG1). Tumors were measured every 2–3 d starting on day 7. Tumor growth is representative of two independent experiments with at least five mice per group. (E and F) Control MC38 and MC38 PD-L1KO tumor cells that stably express GFP or tdTomato were mixed at a 1:1 ratio (input) and either cultured in vitro for 15 d or 105 total cells administered s.c. to TCRα−/− mice or WT mice. Tumor cell composition was analyzed 20 d later. (E) Representative plots were gated on live CD45 fluorescent cells where the numbers within the red and green gates represent the frequency of TdTomato or GFP+ cells, respectively, of live CD45 fluorescent cells. (F) Ratio of frequency of GFP+ and tdTomato+ tumor cells from WT mice and TCRα−/− (Log2(WT/TCRα) mice after 15 d of growth in vivo representative of three independent experiments (n ≥ 4 mice per group). Statistical significance was determined by Student’s t test, where P < 0.05.

References

    1. Ahmadzadeh M., Johnson L.A., Heemskerk B., Wunderlich J.R., Dudley M.E., White D.E., and Rosenberg S.A.. 2009. Tumor antigen-specific CD8 T cells infiltrating the tumor express high levels of PD-1 and are functionally impaired. Blood. 114:1537–1544. 10.1182/blood-2008-12-195792 - DOI - PMC - PubMed
    1. Akhmetzyanova I., Drabczyk M., Neff C.P., Gibbert K., Dietze K.K., Werner T., Liu J., Chen L., Lang K.S., Palmer B.E., et al. . 2015. PD-L1 expression on retrovirus-infected cells mediates immune escape from CD8+ T cell killing. PLoS Pathog. 11:e1005224 10.1371/journal.ppat.1005224 - DOI - PMC - PubMed
    1. Alme A.K., Karir B.S., Faltas B.M., and Drake C.G.. 2016. Blocking immune checkpoints in prostate, kidney, and urothelial cancer: An overview. Urol. Oncol. 34:171–181. 10.1016/j.urolonc.2016.01.006 - DOI - PMC - PubMed
    1. Azuma T., Yao S., Zhu G., Flies A.S., Flies S.J., and Chen L.. 2008. B7-H1 is a ubiquitous antiapoptotic receptor on cancer cells. Blood. 111:3635–3643. 10.1182/blood-2007-11-123141 - DOI - PMC - PubMed
    1. Blank C., Brown I., Peterson A.C., Spiotto M., Iwai Y., Honjo T., and Gajewski T.F.. 2004. PD-L1/B7H-1 inhibits the effector phase of tumor rejection by T cell receptor (TCR) transgenic CD8+ T cells. Cancer Res. 64:1140–1145. 10.1158/0008-5472.CAN-03-3259 - DOI - PubMed

Publication types