. 2017 May 1;77(9):2255-2265.
doi: 10.1158/0008-5472.CAN-16-2822. Epub 2017 Feb 20.

Genomic and Epigenomic Heterogeneity of Hepatocellular Carcinoma

Affiliations

Genomic and Epigenomic Heterogeneity of Hepatocellular Carcinoma

De-Chen Lin et al. Cancer Res. .

Abstract

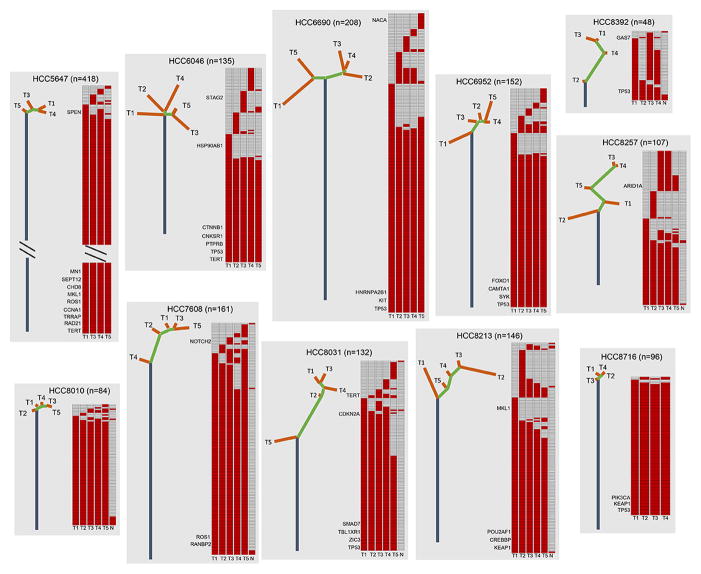
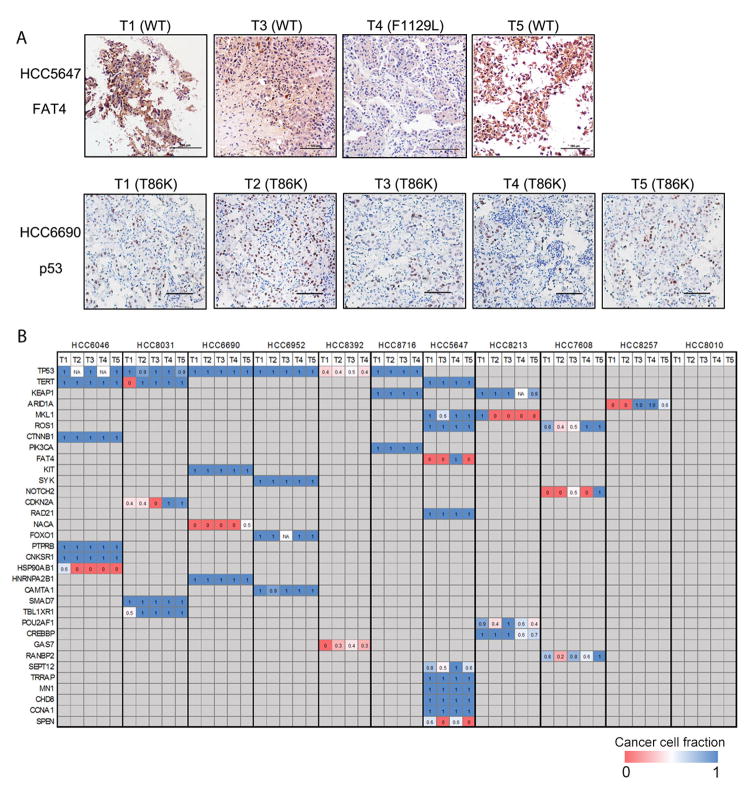
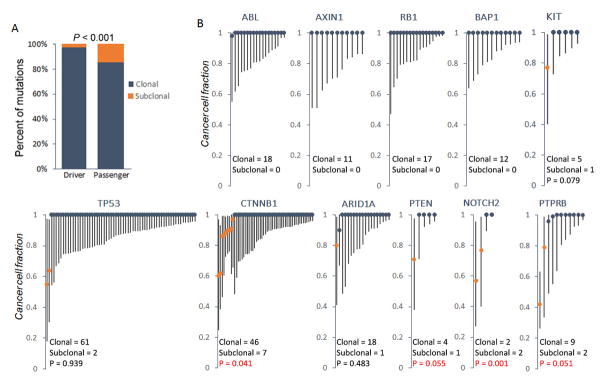
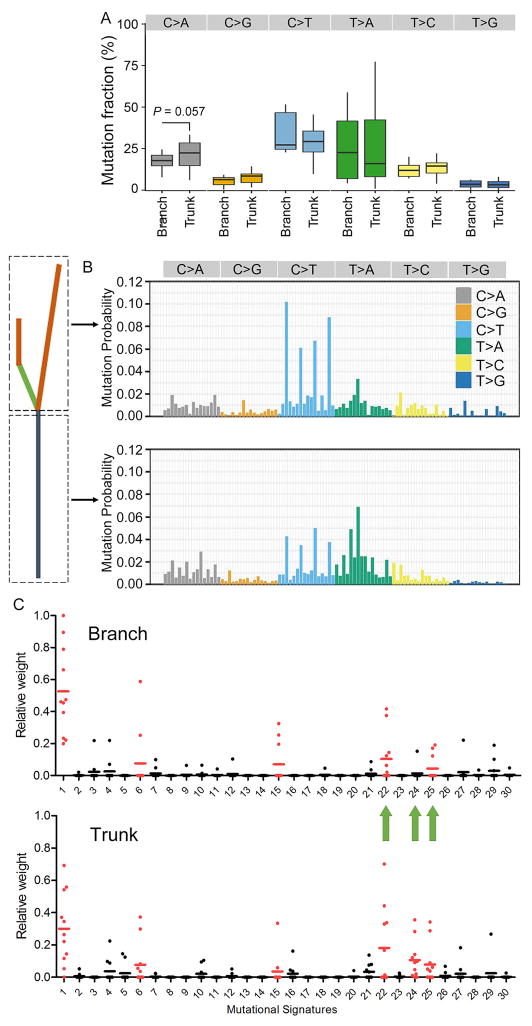
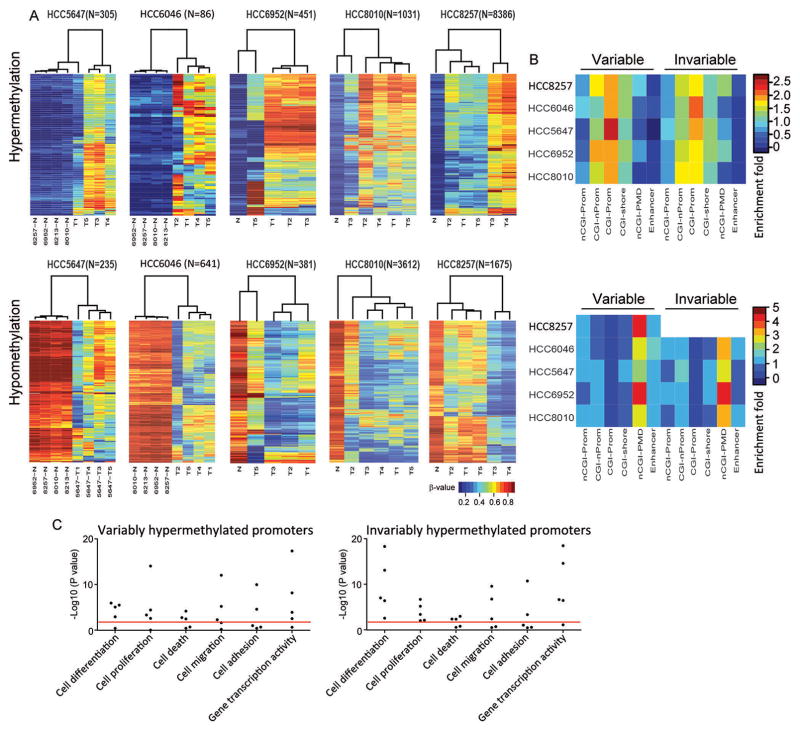
Understanding the intratumoral heterogeneity of hepatocellular carcinoma is instructive for developing personalized therapy and identifying molecular biomarkers. Here we applied whole-exome sequencing to 69 samples from 11 patients to resolve the genetic architecture of subclonal diversification. Spatial genomic diversity was found in all 11 hepatocellular carcinoma cases, with 29% of driver mutations being heterogeneous, including TERT, ARID1A, NOTCH2, and STAG2. Similar with other cancer types, TP53 mutations were always shared between all tumor regions, that is, located on the "trunk" of the evolutionary tree. In addition, we found that variants within several drug targets such as KIT, SYK, and PIK3CA were mutated in a fully clonal manner, indicating their therapeutic potentials for hepatocellular carcinoma. Temporal dissection of mutational signatures suggested that mutagenic processes associated with exposure to aristolochic acid and aflatoxin might play a more important role in early, as opposed to late, stages of hepatocellular carcinoma development. Moreover, we observed extensive intratumoral epigenetic heterogeneity in hepatocellular carcinoma based on multiple independent analytical methods and showed that intratumoral methylation heterogeneity might play important roles in the biology of hepatocellular carcinoma cells. Our results also demonstrated prominent heterogeneity of intratumoral methylation even in a stable hepatocellular carcinoma genome. Together, these findings highlight widespread intratumoral heterogeneity at both the genomic and epigenomic levels in hepatocellular carcinoma and provide an important molecular foundation for better understanding the pathogenesis of this malignancy. Cancer Res; 77(9); 2255-65. ©2017 AACR.


Conflict of interest statement

The authors have no potential conflicts of interest to disclose.

Figures

Figure 1
Figure 1. Phylogenetic trees of 11 HCCs constructed on the basis of M-WES
Phylogenetic trees were constructed from all somatic variants by Wagner parsimony method using PHYLIP (See Method). Blue, green, and orange lines represent trunk, shared branch, and private branch, respectively. Lengths of trunk and branch are proportional to their number of mutations. Putative driver events are mapped along the trees as indicated. Heat maps indicate the presence (red) or absence (grey) of a mutation in each tumor region (T) or matched nonmalignant liver tissue (N). For case HCC5647, trunk length was reduced for display purpose.
Figure 2
Figure 2. Spatial heterogeneity and CCF of putative driver mutations in HCC
(A) IHC staining of FAT4 and p53 in different tumor regions which have been profiled by M-WES. Mutational status is indicated on top of each region. Scale bars, 100 μm. WT, wildtype. (B) Heat map of the CCF of putative driver mutations. Numeric number in each square shows the CCF. Columns, tumor regions; Rows, genes.
Figure 3
Figure 3. Clonal status of HCC driver mutations sequenced by TCGA
(A) The proportion of clonal and subclonal mutations in both driver and passenger events. (B) CCF analysis of mutations in representative driver genes from TCGA HCC dataset. Each line represents an individual mutation. Round dot, upper and lower end of each line represents CCF, upper and lower bound of confidence interval, respectively. Clonal and subclonal CCF are shown as dark blue and orange, respectively. Driver genes were identified using MutSig algorithm (28) on the basis of the TCGA data (FDR q < 0.1). P values were derived by hypergeometric tests comparing the frequency of subclonal mutations in each gene against that in all driver genes. In those genes without any subclonal mutations, P value was not calculated.
Figure 4
Figure 4. Temporal dissection of HCC mutational spectra and signatures
(A) Pairwise fraction analysis of truncal and branch variants on the basis of the six mutation classes. P values were derived by Paired Students’ T-test upon verification of normality and variance within each group, with those over 0.1 not shown. (B) Mutational signatures of all truncal and branch variants was inferred by deconstructSigs. Signatures are displayed according to the 96-substitution classification defined by the substitution class and sequence context (12). (C) Dot plots display the contributions of individual mutational signatures to individual cases, with each dot representing one case. Signatures 1–30 were based on the Wellcome Trust Sanger Institute Mutational Signature Framework (12).
Figure 5
Figure 5. Epigenetic intratumoral heterogeneity in HCC
(A) Unsupervised hierarchical clustering of intratumoral methylation profiling of five HCC cases. Rows of the heat maps denote the methylation levels of variably hypermethylated (upper panel) or hypomethylated (upper panel) CpG sites across different tumor regions. Columns represent samples. (B) Enrichment plots showing the distribution of both variably and invariably hypermethylated (upper panel) or hypomethylated (lower panel) CpG sites across a variety of functional genomic domains. nCGI-Prom (non CG island Promoter); CGI-nProm, (CG islands not in promoter regions); CGI-Prom, CG island promoters; nCGI-PMD, PMD excluding CGI probes. All P values of hypergeometric enrichment test (comparing the frequency of each variable and invariable probe set category to that of array background) were shown in the Supplementary Table 6. (C) Dot plots displaying enriched GO biological processes for the genes associated with variably and invariably hypermethylated promoters, with each dot representing one individual case. Red line indicates P value of 0.01.

References

    1. Lozano R, Naghavi M, Foreman K, Lim S, Shibuya K, Aboyans V, et al. Global and regional mortality from 235 causes of death for 20 age groups in 1990 and 2010: a systematic analysis for the Global Burden of Disease Study 2010. Lancet. 2012;380:2095–128. - PMC - PubMed
    1. Forner A, Llovet JM, Bruix J. Hepatocellular carcinoma. Lancet. 2012;379:1245–55. - PubMed
    1. El-Serag HB. Hepatocellular carcinoma. The New England journal of medicine. 2011;365:1118–27. - PubMed
    1. Guichard C, Amaddeo G, Imbeaud S, Ladeiro Y, Pelletier L, Maad IB, et al. Integrated analysis of somatic mutations and focal copy-number changes identifies key genes and pathways in hepatocellular carcinoma. Nature genetics. 2012;44:694–8. - PMC - PubMed
    1. Kan Z, Zheng H, Liu X, Li S, Barber TD, Gong Z, et al. Whole-genome sequencing identifies recurrent mutations in hepatocellular carcinoma. Genome research. 2013;23:1422–33. - PMC - PubMed

Publication types

Substances