. 2017 Mar 17;355(6330):1174-1180.
doi: 10.1126/science.aag2516. Epub 2017 Mar 16.

Structural basis of the day-night transition in a bacterial circadian clock

Affiliations

Structural basis of the day-night transition in a bacterial circadian clock

Roger Tseng et al. Science. .

Abstract

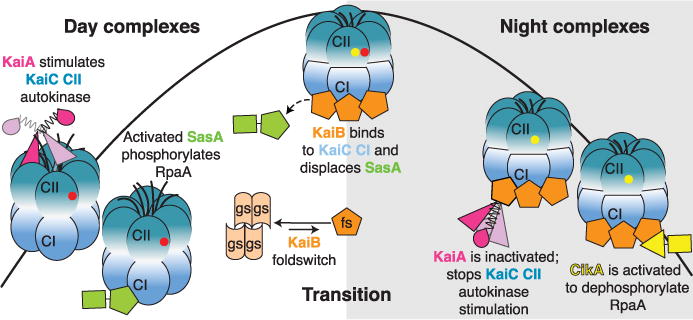
Circadian clocks are ubiquitous timing systems that induce rhythms of biological activities in synchrony with night and day. In cyanobacteria, timing is generated by a posttranslational clock consisting of KaiA, KaiB, and KaiC proteins and a set of output signaling proteins, SasA and CikA, which transduce this rhythm to control gene expression. Here, we describe crystal and nuclear magnetic resonance structures of KaiB-KaiC,KaiA-KaiB-KaiC, and CikA-KaiB complexes. They reveal how the metamorphic properties of KaiB, a protein that adopts two distinct folds, and the post-adenosine triphosphate hydrolysis state of KaiC create a hub around which nighttime signaling events revolve, including inactivation of KaiA and reciprocal regulation of the mutually antagonistic signaling proteins, SasA and CikA.


Figures

Fig. 1
Fig. 1. Model of circadian formation of cyanobacterial clock protein complexes
During the day, KaiA binds to the C-terminal extensions of KaiC to enhance the autokinase activity of the CII domain of KaiC, leading to sequential autophosphorylation. Yellow and red circles represent phosphorylated S431 (pS) and T432 (pT), respectively. The sensor histidine kinase, SasA, is activated by KaiC. During the day, the hexameric CII ring is loose and unstacked from the hexameric CI ring. At dusk, phosphorylation of S431 tightens the CII ring, leading to withdrawal of the KaiA binding sites on CII. The tightened CII ring interacts and stabilizes the CI ring in its post-ATP hydrolysis state, which now has its KaiB binding sites exposed. The rare fold-switched state of KaiB, KaiBfs, cooperatively binds CI, displacing SasA. KaiBfs sequesters the autoinhibited conformation of KaiA, allowing autodephosphorylation of KaiC. KaiBfs also binds and activates the phosphatase activity of CikA. Upon autodephosphorylation of S431, the CII ring loosens, causing unstacking of the rings. The CI ring returns to its pre-ATP hydrolysis state, letting go of KaiB, KaiA, and CikA to begin a new day.
Fig. 2
Fig. 2. Fold-switched KaiB binds to the posthydrolysis state of the CI domain of KaiC
(A) Crystal structure of the KaiBfs-cryst-CIcryst complex at 1.8 Å. Orange, KaiBfs-cryst; sky-blue, CIcryst. (B) Secondary structures of KaiBgs (PDB 2QKE, subunit A) and KaiBfs-cryst bound to CIcryst. Residues of KaiBfs-cryst that interact with CIcryst are highlighted in green. (C) Zoomed-in view of the boxed region in (A). Representative interacting residues in (B) are shown in green. Dashed lines: electrostatic KaiBfs-cryst-CIcryst interactions. (D) Superposition of CI structures before ATP hydrolysis. Sky-blue, CIcryst; dark green, pre-ATP hydrolysis state of CISe (PDB 4TLC, subunit C), missing density for the B loop. Residue numbers in CISe are offset from those of T. elongatus CI by −1. (E) Superposition of CI structures after ATP hydrolysis. Sky blue, CIcryst; magenta, post-ATP hydrolysis state of CISe (PDB 4TLA, subunit E). Please see fig. S1 and table S1 for construct details.
Fig. 3
Fig. 3. KaiB assembles as a ring on the posthydrolysis state of KaiC
(A) The hexameric KaiBfs-cryst*-KaiCS431E complex at 3.87 Å. KaiCS431E includes CII hexamer (dark cyan) and CI hexamer (sky blue). Orange, KaiBfs-cryst*. (B) Zoomed-in view of the boxed region in (A) showing bound ADP highlighted by mesh representing the (FobsFcalc) omit maps contoured at 2.5σ. Fobs is the observed structure-factor amplitude, and Fcalc is the calculated structure-factor amplitude. (C) Zoomed-in view of the boxed region in (A) showing KaiBfs-cryst* interfaces in the KaiBfs-cryst*-KaiCS431E hexamer. Interfacial residues are shown in nontransparent mode. (D) Columbic electrostatic surface map of the interfacial residues between two subunits of KaiBfs-cryst*. See fig. S1 and table S1 for construct details.
Fig. 4
Fig. 4. The mechanism of KaiA autoinhibition is revealed by the KaiAcryst-KaiBfs-cryst-CIcryst complex
(A) The ternary KaiAcryst-KaiBfs-cryst-CIcryst complex at 2.6 Å. Orange, KaiBfs-cryst; sky blue, CIcryst; orchid, KaiAcryst. (B) Zoomed-in view of the boxed region in (A). Dashed lines: electrostatic interactions. (C) Conformational changes of dimeric KaiA. NTD, N-terminal domain. Prime symbols denote the other protomer within the dimer. (Left) Crystal structure (PDB 5C5E) of KaiASe (purple) bound to KaiC CIISe peptides (dark cyan). (Right) The KaiAcryst-KaiBfs-cryst-CIcryst complex, with same coloring scheme as in (A). (Middle) Superposition of KaiASe (left) and KaiAcryst in complex (right); only α5 helices and b6 strands are shown. (D) Fluorescence anisotropy of 6IAF-labeled CII peptides (0.05 μM). Open circles, 0 μM KaiA, titration with CIcryst and KaiBfs-cryst; triangles, 10 μM KaiA, titration with CIcryst; diamonds, 10 μM KaiA, titration with KaiBfs-cryst; squares, 10 μM KaiA, titration with equal molar of KaiBfs-cryst and CIcryst. Error bars, SD from triplicates. (E) Size-exclusion chromatography of ternary complex formation. Wild-type KaiA (green, dashed); wild-type KaiB (red, dashed); CIcryst (orange, dashed); KaiA +KaiB+CIcryst (green); L155A-KaiA+KaiB+CIcryst (cyan); K158A-KaiA+KaiB+CIcryst (blue); D212A-KaiA+ KaiB+CIcryst (purple); D266A-KaiA+KaiB+CIcryst (black); and N212A-D266A-KaiA+ KaiB+CIcryst (red). (F) Bioluminescence rhythms from strains of S. elongatus: wt-kaiASe (blue), complemented with kaiASe (green), L156A-kaiASe (purple), and kaiASe knockout (red). L156A of kaiASe is analogous to L155A in kaiA. See fig. S1 and table S1 for construct details.
Fig. 5
Fig. 5. Structure of the CikAPsR-KaiBfs-nmr complex reveals intermolecular contacts essential for output signaling
(A) Top, ensemble of the 20 lowest-energy NMR structures of the CikAPsR-KaiBfs-nmr complex. Orange, KaiBfs-nmr; khaki, CikAPsR. Bottom, zoomed-in view of boxed regions above using average minimized structure from the ensemble. Dashed lines, intermolecular electrostatic interactions. (B) Bioluminescence rhythms from S. elongatus. wt-cikASe (blue), complemented with cikASe (green), C644R-cikASe (purple), or cikASe knockout (red). C644R of cikASe is analogous to C630R of cikA. (C) Representative cell micrographs. wt-cikASe, complemented with cikASe, C644R-cikASe, or lacking cikASe. Red, membrane autofluorescence. Scale bars, 2.5 μm. (D) Scatter plots of cell lengths. wt-cikASe (blue) (n = 87), complemented with cikASe (green) (n = 110), C644R-cikASe (purple) (n = 353), or lacking cikASe (red) (n = 48). One-way analysis of variance of log10-transformed cell length data produced P < 0.0001. ****, Bonferroni-corrected P values (< 0.0001) for pairwise comparisons to wt-cikASe (α = 0.05). (E) CikAPsR and KaiAcryst compete for the β2 strand of KaiBfs. (Left) Orange, KaiBfs-nmr (top) and KaiBfs-cryst (bottom); khaki, CikAPsR; orchid, KaiAcryst; black lines, backbone-backbone or sidechain-backbone hydrogen bonds. (Right) Selected region of methyl-TROSY spectra of labeled CikAPsR free (black), or mixed with wild-type KaiB+CImono (blue), or with wild-type KaiB+CImono+wild-type KaiA (red). See fig. S5, E and H, for full spectra. Also see fig. S1 and table S1 for construct details.
Fig. 6
Fig. 6. Ground-state KaiB prevents daytime KaiA and CikAPsR recruitment
(A) Superposition of the non–fold-switched region (residues 7 to 46) of KaiBgs (blue) (PDB 2QKE, subunit A) with the ternary KaiAcryst-KaiBfs-cryst-CIcryst structure. (B) and (C) are zoomed-in views of the boxed region in (A). Dashed lines, estimated distance between two atoms. (D) Superposition of the non–fold-switched region (residues 7 to 46) of KaiBgs (blue) (PDB 2QKE, subunit A) with the CikAPsR-KaiBfs-nmr structure. (E) and (F) are zoomed-in views of the boxed region in (D). Dashed lines, estimated distance between two atoms.

Comment in

References

    1. Whitehead K, Pan M, Masumura K, Bonneau R, Baliga NS. PLOS ONE. 2009;4:e5485. - PMC - PubMed
    1. Edgar RS, et al. Nature. 2012;485:459–464. - PMC - PubMed
    1. Kondo T, et al. Proc Natl Acad Sci USA. 1993;90:5672–5676. - PMC - PubMed
    1. Pittendrigh CS. Proc Natl Acad Sci USA. 1954;40:1018–1029. - PMC - PubMed
    1. Konopka RJ, Benzer S. Proc Natl Acad Sci USA. 1971;68:2112–2116. - PMC - PubMed

Publication types

MeSH terms

Substances