. 2017 Mar 16;7(1):205.
doi: 10.1038/s41598-017-00324-3.

Human pressures and ecological status of European rivers

Affiliations

Human pressures and ecological status of European rivers

B Grizzetti et al. Sci Rep. .

Erratum in

Abstract

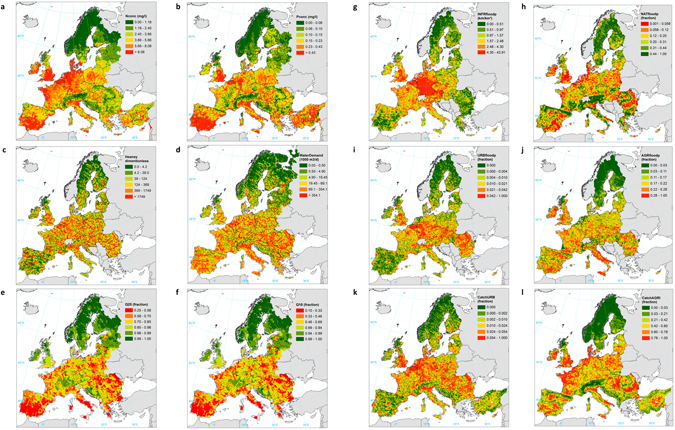
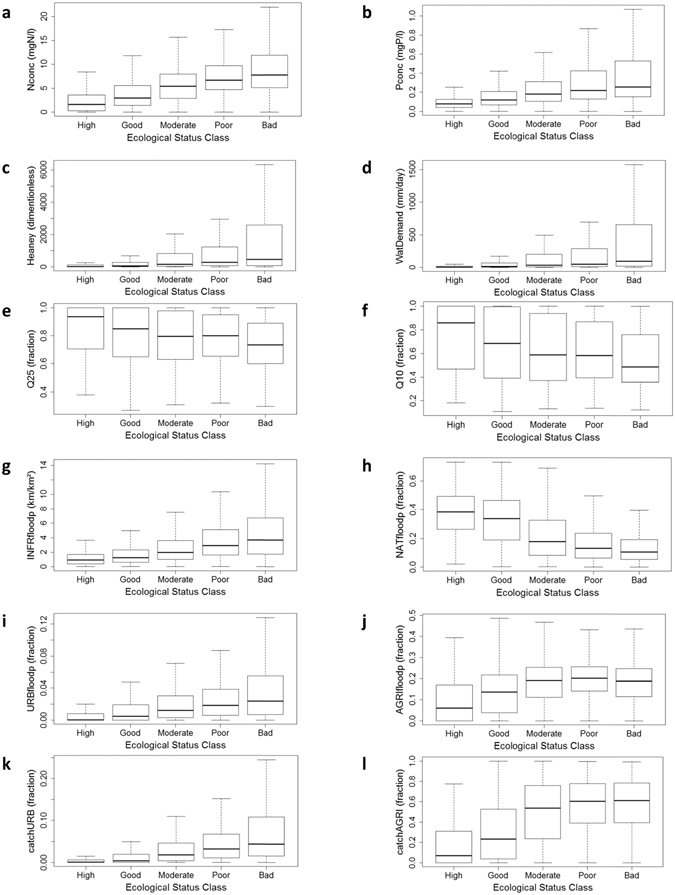
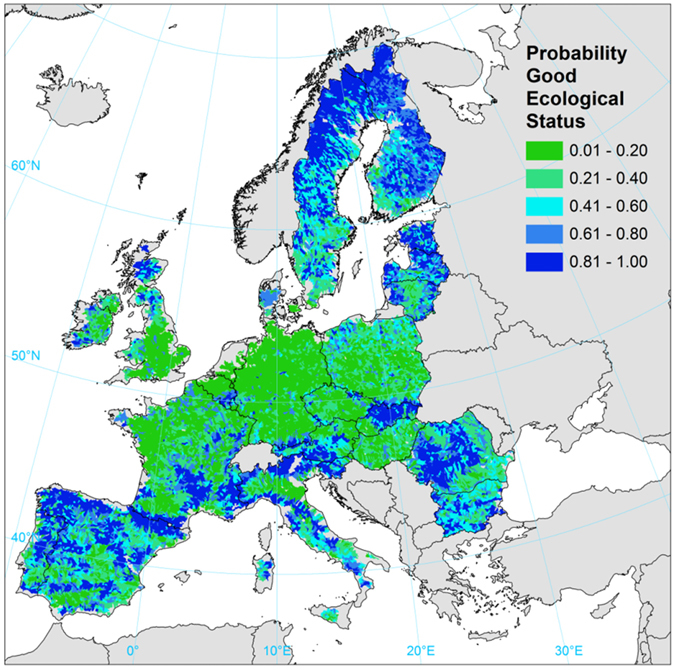
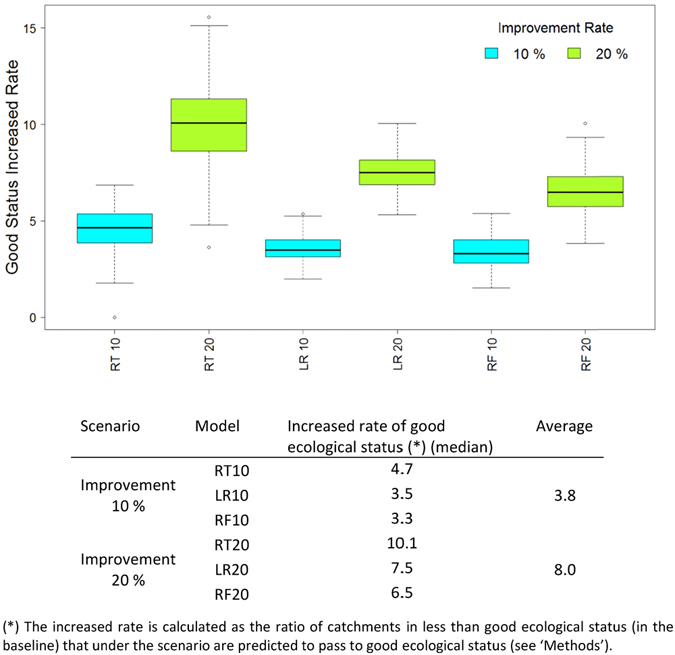
Humans have increased the discharge of pollution, altered water flow regime and modified the morphology of rivers. All these actions have resulted in multiple pressures on freshwater ecosystems, undermining their biodiversity and ecological functioning. The European Union has adopted an ambitious water policy to reduce pressures and achieve a good ecological status for all water bodies. However, assessing multiple pressures on aquatic ecosystems and understanding their combined impact on the ecological status is challenging, especially at the large scale, though crucial to the planning of effective policies. Here, for the first time, we quantify multiple human pressures and their relationship with the ecological status for all European rivers. We considered ecological data collected across Europe and pressures assessed by pan-European models, including pollution, hydrological and hydromorphological alterations. We estimated that in one third of EU's territory rivers are in good ecological status. We found that better ecological status is associated with the presence of natural areas in floodplains, while urbanisation and nutrient pollution are important predictors of ecological degradation. We explored scenarios of improvement of rivers ecological status for Europe. Our results strengthen the need to halt urban land take, curb nitrogen pollution and maintain and restore nature along rivers.


Conflict of interest statement

The authors declare that they have no competing interests.

Figures

Figure 1
Figure 1
Maps of pressures on European rivers. (a) Nitrogen concentration; (b) phosphorus concentration; (c) pollution from urban runoff; (d) water demand; (e) preservation of low flow at 25th percentile; (f) preservation of low flow at 10th percentile; (g) infrastructures in floodplains; (h) natural areas in floodplains; (i) urban areas in floodplains; (j) agricultural areas in floodplains; (k) artificial land cover in catchment area; (l) agricultural land cover in catchment area. Details of the pressures indicators are in Table 1. Maps generated with ArcGIS 10.1 for desktop (http://www.esri.com/software/arcgis).
Figure 2
Figure 2
Relationship between the indicators of pressures and the proxy of the ecological status. (a) Nitrogen concentration; (b) phosphorus concentration; (c) pollution from urban runoff; (d) water demand; (e) preservation of low flow (at 25th percentile); (f) preservation of low flow (at 10th percentile); (g) infrastructures in floodplains; (h) natural areas in floodplains; (i) urban areas in floodplains; (j) agricultural areas in floodplains; (k) artificial land cover in catchment area; (l) agricultural land cover in catchment area. The indicators of pressures are described in Table 1.
Figure 3
Figure 3
Model results. (a) Accuracy of classification using the regression tree (RT), logistic regression (LR) and random forest (RF) models. (b) Importance of the variables in the classification of the random forest method computed by the mean decrease Gini index, . The analysis refers to the period 2004–2009, for which data on the ecological status were reported and most of the pressures indicators were available.
Figure 4
Figure 4
Probability of good ecological status of rivers. Values estimated by the random forest method applied to all catchments with complete data on pressures (89% of EU). Map generated with ArcGIS 10.1 for desktop (http://www.esri.com/software/arcgis).
Figure 5
Figure 5
Distribution of model accuracy and errors per country. The values within brackets indicate the number of catchments with available data. Results are based on the random forest method. The analysis refers to the period 2004–2009, for which data on the ecological status were reported and most of the pressures indicators were available.
Figure 6
Figure 6
Scenarios of measures for improvement of river ecological status. The scenarios are simulated by the three classification methods: regression tree (RT), logistic regression (LR) and random forest (RF). The scenarios ‘measures for improvement’ estimate the effects of contemporary reduction of nitrogen concentration in rivers and the increase of natural areas in floodplains, considering improvement rates of 10% and 20%.

References

    1. Meybeck M. Global analysis of river systems: from Earth system controls to Anthropocene syndromes. Philosophical Transactions of the Royal Society B: Biological Sciences. 2003;358:1935–1955. doi: 10.1098/rstb.2003.1379. - DOI - PMC - PubMed
    1. Sutton, M. et al.The European Nitrogen Assessment. Cambridge University Press, Cambridge (2011).
    1. Fowler D, et al. The global nitrogen cycle in the Twenty-first century. Philosophical Transactions of the Royal Society B: Biological Sciences. 2013;368:20130164. doi: 10.1098/rstb.2013.0164. - DOI - PMC - PubMed
    1. Belletti B, Rinaldi M, Buijse AD, Gurnell AM, Mosselman E. A review of assessment methods for river hydromorphology. Environmental Earth Sciences. 2015;73:2079–2100. doi: 10.1007/s12665-014-3558-1. - DOI
    1. Sweeney BW, et al. Riparian deforestation, stream narrowing, and loss of stream ecosystem services. Proceedings of the National Academy of Sciences of the United States of America. 2004;101:14132–14137. doi: 10.1073/pnas.0405895101. - DOI - PMC - PubMed

Publication types

LinkOut - more resources