

Effects of high-intensity interval training and moderate-intensity continuous training on glycaemic control and skeletal muscle mitochondrial function in db/db mice
- PMID: 28303003
- PMCID: PMC5427962
- DOI: 10.1038/s41598-017-00276-8
Effects of high-intensity interval training and moderate-intensity continuous training on glycaemic control and skeletal muscle mitochondrial function in db/db mice
Abstract
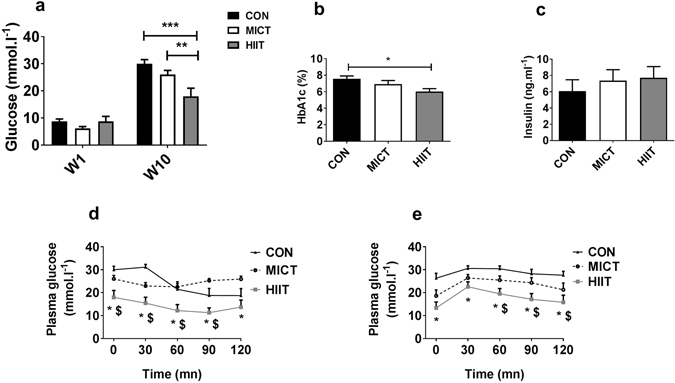
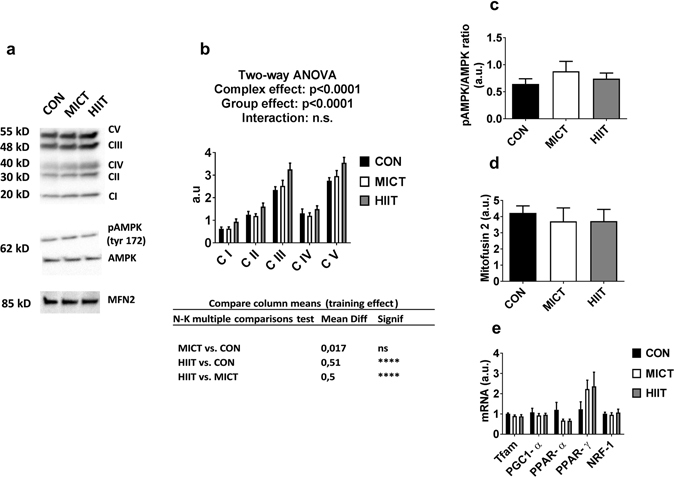
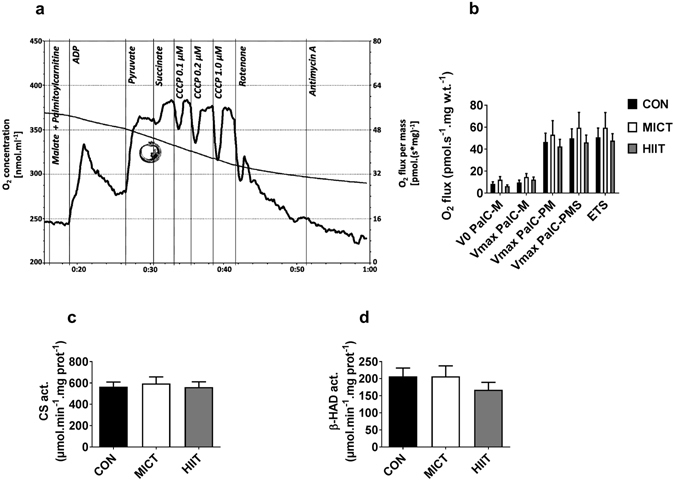
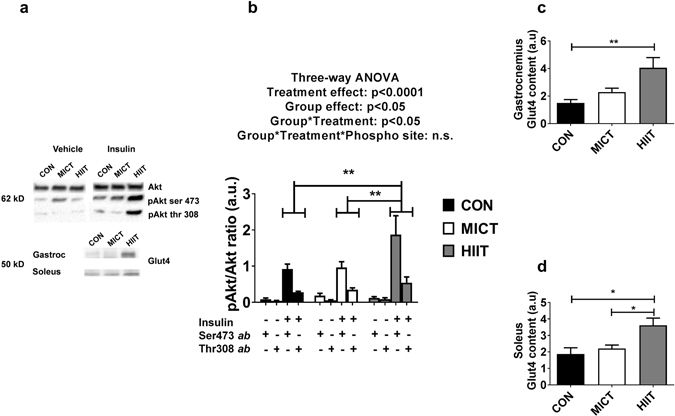
Physical activity is known as an effective strategy for prevention and treatment of Type 2 Diabetes. The aim of this work was to compare the effects of a traditional Moderate Intensity Continuous Training (MICT) with a High Intensity Interval Training (HIIT) on glucose metabolism and mitochondrial function in diabetic mice. Diabetic db/db male mice (N = 25) aged 6 weeks were subdivided into MICT, HIIT or control (CON) group. Animals in the training groups ran on a treadmill 5 days/week during 10 weeks. MICT group ran for 80 min (0° slope) at 50-60% of maximal speed (Vmax) reached during an incremental test. HIIT group ran thirteen times 4 minutes (20° slope) at 85-90% of Vmax separated by 2-min-rest periods. HIIT lowered fasting glycaemia and HbA1c compared with CON group (p < 0.05). In all mitochondrial function markers assessed, no differences were noted between the three groups except for total amount of electron transport chain proteins, slightly increased in the HIIT group vs CON. Western blot analysis revealed a significant increase of muscle Glut4 content (about 2 fold) and higher insulin-stimulated Akt phosphorylation ratios in HIIT group. HIIT seems to improve glucose metabolism more efficiently than MICT in diabetic mice by mechanisms independent of mitochondrial adaptations.
Conflict of interest statement
The authors declare that they have no competing interests.
Figures
Similar articles
-
Comparative effects of high-intensity interval training and moderate-intensity continuous training on soleus muscle fibronectin type III domain-containing protein 5, myonectin and glucose transporter type 4 gene expressions: a study on the diabetic rat model.Mol Biol Rep. 2021 Aug;48(8):6123-6129. doi: 10.1007/s11033-021-06633-1. Epub 2021 Aug 10. Mol Biol Rep. 2021. PMID: 34374894
-
The Combined Effect of High-Intensity Interval Training and Time-Restricted Feeding on the AKT-IGF-1-mTOR Signaling Pathway in the Muscle Tissue of Type 2 Diabetic Rats.Nutrients. 2025 Apr 22;17(9):1404. doi: 10.3390/nu17091404. Nutrients. 2025. PMID: 40362714 Free PMC article.
-
A Comparative Study of Health Efficacy Indicators in Subjects with T2DM Applying Power Cycling to 12 Weeks of Low-Volume High-Intensity Interval Training and Moderate-Intensity Continuous Training.J Diabetes Res. 2022 Jan 13;2022:9273830. doi: 10.1155/2022/9273830. eCollection 2022. J Diabetes Res. 2022. PMID: 35071605 Free PMC article. Clinical Trial.
-
Effect of high-intensity interval training protocols on VO2max and HbA1c level in people with type 2 diabetes: A systematic review and meta-analysis.Ann Phys Rehabil Med. 2022 Sep;65(5):101586. doi: 10.1016/j.rehab.2021.101586. Epub 2021 Nov 19. Ann Phys Rehabil Med. 2022. PMID: 34648979
-
Effectiveness of High-Intensity Interval Training Versus Moderate-Intensity Continuous Training in Hypertensive Patients: a Systematic Review and Meta-Analysis.Curr Hypertens Rep. 2020 Mar 3;22(3):26. doi: 10.1007/s11906-020-1030-z. Curr Hypertens Rep. 2020. PMID: 32125550
Cited by
-
Ethical consideration and feasibility demonstration of high-intensity interval training without the use of electrical shocks in mice with and without doxorubicin exposition.Am J Cancer Res. 2019 Dec 1;9(12):2813-2820. eCollection 2019. Am J Cancer Res. 2019. PMID: 31911864 Free PMC article.
-
Effect of 32-Weeks High-Intensity Interval Training and Resistance Training on Delaying Sarcopenia: Focus on Endogenous Apoptosis.Front Physiol. 2022 Apr 28;13:811369. doi: 10.3389/fphys.2022.811369. eCollection 2022. Front Physiol. 2022. PMID: 35574455 Free PMC article.
-
High-resolution Respirometry to Measure Mitochondrial Function of Intact Beta Cells in the Presence of Natural Compounds.J Vis Exp. 2018 Jan 23;(131):57053. doi: 10.3791/57053. J Vis Exp. 2018. PMID: 29443067 Free PMC article.
-
Short Session High Intensity Interval Training and Treadmill Assessment in Aged Mice.J Vis Exp. 2019 Feb 2;(144):10.3791/59138. doi: 10.3791/59138. J Vis Exp. 2019. PMID: 30774134 Free PMC article.
-
The TOTUM-63 Supplement and High-Intensity Interval Training Combination Limits Weight Gain, Improves Glycemic Control, and Influences the Composition of Gut Mucosa-Associated Bacteria in Rats on a High Fat Diet.Nutrients. 2021 May 7;13(5):1569. doi: 10.3390/nu13051569. Nutrients. 2021. PMID: 34066988 Free PMC article.
References
-
- American Diabetes Association. Physical Activity/Exercise and Diabetes. Diabetes Care27, s58–s62 (2004).
Publication types
MeSH terms
Substances
LinkOut - more resources
Full Text Sources
Other Literature Sources
Medical
Miscellaneous
