Review
. 2017 Mar 17;18(4):222-235.
doi: 10.1038/nrn.2017.15.

Integration of optogenetics with complementary methodologies in systems neuroscience

Affiliations
Review

Integration of optogenetics with complementary methodologies in systems neuroscience

Christina K Kim et al. Nat Rev Neurosci. .

Abstract

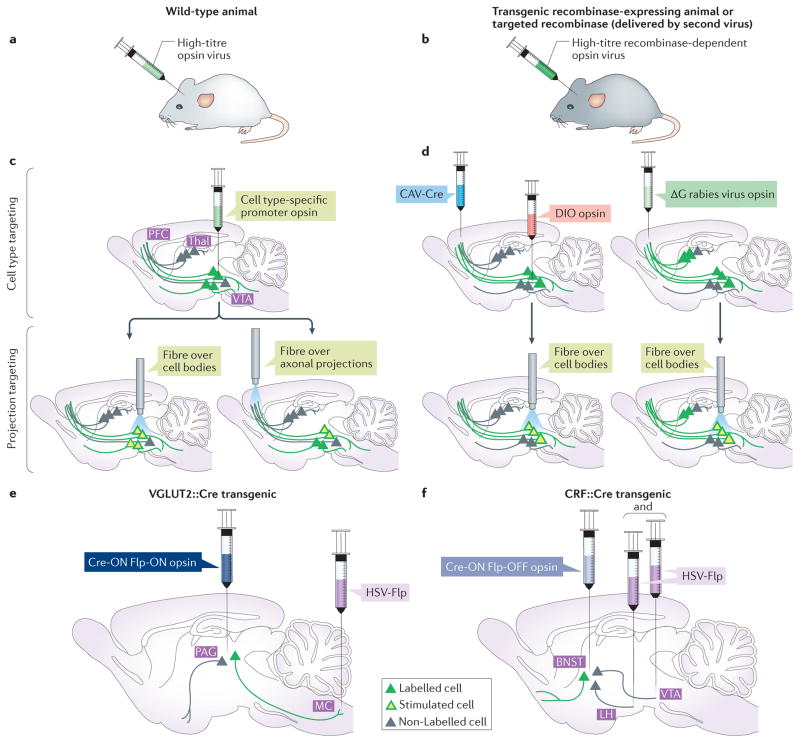
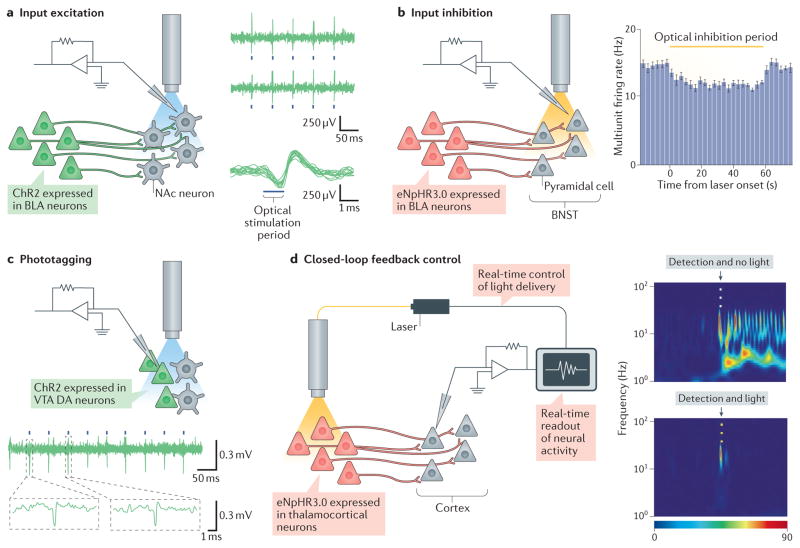
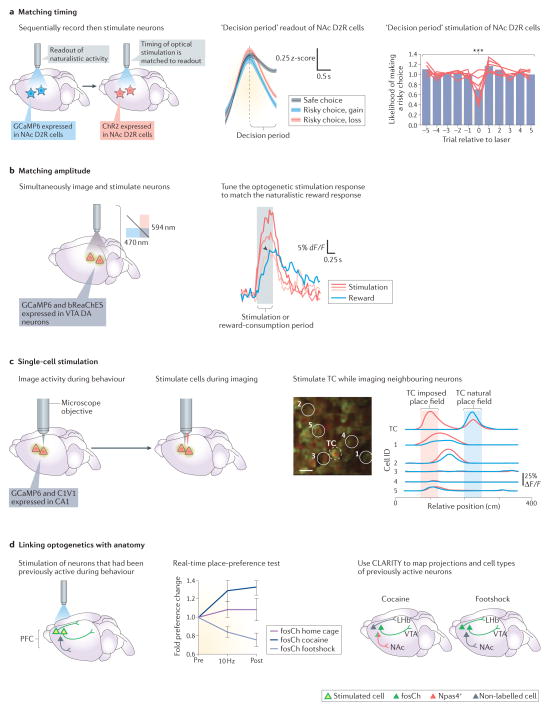
Modern optogenetics can be tuned to evoke activity that corresponds to naturally occurring local or global activity in timing, magnitude or individual-cell patterning. This outcome has been facilitated not only by the development of core features of optogenetics over the past 10 years (microbial-opsin variants, opsin-targeting strategies and light-targeting devices) but also by the recent integration of optogenetics with complementary technologies, spanning electrophysiology, activity imaging and anatomical methods for structural and molecular analysis. This integrated approach now supports optogenetic identification of the native, necessary and sufficient causal underpinnings of physiology and behaviour on acute or chronic timescales and across cellular, circuit-level or brain-wide spatial scales.


Conflict of interest statement

Competing interests statement

The authors declare no competing interests.

Figures

Figure 1
Figure 1. Approaches to opsin targeting with anatomical and cell type specificity
a,b | The schematics demonstrate the method for expressing opsins in neurons. A DNA vector encoding an opsin is packaged into a high-titre virus (most often adeno-associated virus (AAV)), and this virus is injected into the brain region of interest, inducing opsin expression in target neurons. Cell type specificity of opsin expression can be achieved either by using a cell type-specific promoter virus in a wild-type animal (part a) or by using a recombinase-dependent (for example, Cre-dependent) virus in a transgenic recombinase-driver animal or with a secondary virus containing a targeted recombinase (part b). c | Following opsin expression in the cell population of interest (green cells; top panel), a light-delivering optical fibre can be placed either over the cell bodies to target all projection neurons (bottom left panel) or in a known downstream region to target a specific projection (bottom right panel). d | A retrograde virus such as canine adenovirus (CAV)-Cre and a Cre-dependent doubly floxed inverted opsin (DIO) virus can be injected into the downstream and upstream region, respectively, to label only a specific projection with opsin. The fibre can then be placed over the cell bodies to manipulate that projection (left panel). Glycoprotein-deleted (ΔG) rabies virus can also be injected into a brain region to retrogradely label all presynaptic inputs. To activate a specific presynaptic input, the fibre can be placed over the input structure studied (right panel). e | The retrograde virus herpes simplex virus (HSV)-Flp can be used in conjunction with combinatorial INTRSECT Cre-dependent and Flp-dependent viruses in transgenic Cre animals (or with Cre viruses) to heighten projection-labelling specificity. For example, HSV-Flp and a Cre-ON Flp-ON channelrhodopsin (ChR) virus can be used to label vesicular glutamate transporter 2 (VGLUT2)-expressing neurons in a Cre transgenic mouse that project from the periaquaductual grey (PAG) to the magnocellular nucleus (MC) of the medulla. f | This method can also be used to exclude a particular projection target. Corticotropin-releasing factor (CRF)-expressing neurons in the bed nucleus of the stria terminalis (BNST) that do not project to either the lateral hypothalamus (LH) or the ventral tegmental area (VTA) can be labelled in a Cre transgenic mouse using a Cre-ON Flp-OFF ChR virus in conjunction with HSV-Flp. PFC, prefrontal cortex; Thal, thalamus. Part e is adapted with permission from REF. , Macmillan Publishers Limited. Part f is adapted with permission from REF. , Macmillan Publishers Limited.
Figure 2
Figure 2. Integrating optogenetic control with in vivo electrophysiology
a | The left panel shows optogenetic stimulation of axons from the basolateral amygdala (BLA) in which channelrhodopsin 2 (ChR2) has been expressed while simultaneously monitoring downstream activity in the nucleus accumbens (NAc). The right panel shows that optogenetic stimulation of BLA terminals in the NAc results in downstream electrical spiking in local NAc neurons. The top traces are example electrophysiological recordings exhibiting reproducible spiking in response to 1 ms optogenetic stimulation pulses (blue ticks). The bottom trace plots overlay trials of electrical spiking, aligned to the time of optogenetic stimulation (blue bar). b | Optogenetic modulation of bed nucleus of the stria terminalis (BNST) activity through optogenetic inhibition of afferent BLA axons is shown (left panel). Inhibition of BLA terminals in the BNST that express eNpHR3.0 results in net reduction in multiunit firing rate in the local BNST neurons (right panel; the yellow bar indicates the optical stimulation period); in other brain regions, highly efficacious in vivo input modulation may not cause such mean overall rate changes but instead modulates other features of regional computation and behavioural output. c | Phototagging can be used to identify and stimulate genetically specified ventral tegmental area (VTA) dopaminergic (DA) neurons expressing a ChR. ChR-expressing VTA DA cells, in this case, may be identified during in vivo recordings by responsiveness to pulses of blue light (blue ticks in voltage trace) and can be distinguished from non-expressing cells, which do not respond. Two examples of light-triggered spikes are shown in the bottom panel. d | Real-time closed-loop optogenetic inhibition of thalamocortical neurons is triggered when seizure activity is detected in the cortex by electroencephalography (EEG). Incipient seizures are detected in the cortex by EEG (in the figure, indicated by the black arrowhead above spectrogram), which in the absence of optical stimulation result in ongoing seizure activity, shown in pseudocolour (the red end of the spectrum indicates highest activity) by the rapid spiking and intense red spots in the upper panel. When seizure detection triggers yellow-light delivery to thalamocortical neurons, it results in an interruption of the seizure (bottom panel). Part a is reproduced with permission from REF. , Macmillan Publishers Limited. Part b is reproduced with permission from REF. , Macmillan Publishers Limited. Part c is reproduced with permission from REF. , Macmillan Publishers Limited. Part d is adapted with permission from REF. , Macmillan Publishers Limited.
Figure 3
Figure 3. Integrating optogenetic control with optical methods: matching naturally occurring activity patterns and linking to brain-wide projection activity
a | Matching timing: Ca2+ recording of nucleus accumbens (NAc) D2 dopamine receptor (D2R) neurons expressing the sensor GCaMP6 in one cohort of mice was used to guide optogenetic stimulation timing parameters of channelrhodopsin-expressing NAc D2R neurons in another cohort of mice (left panel). The activity of NAc D2R neurons was recorded during a risky decision-making task (middle panel). The graph shows that the activity during the decision-making period is lower on trials wherein the animal makes a risky versus safe decision, independent of whether the risky decision resulted in a gain or loss. Stimulation of NAc D2R neurons to mimic timing of activity during the task-decision period (using the method shown in panel a) produced an instantaneous, reversible and significant (P < 0.001) reduction in risk seeking (zero timepoint on the x axis); stimulation during other task epochs was much less effective. b | Matching amplitude: this paradigm is designed to simultaneously stimulate and record from ventral tegmental area (VTA) dopaminergic (DA) neurons to match evoked responses to naturally occurring responses (left panel). Right panel: three optogenetically evoked responses (shades of red) could be titrated to closely resemble VTA DA response amplitude to natural reward consumption (blue) in the same animal (in the figure, the black arrowhead indicates similar amplitudes of the evoked response and the natural reward response). c | The left panel shows simultaneous imaging and manipulation of local circuit dynamics in hippocampal CA1 on a cellular level. The example two-photon image shows individual hippocampal neurons expressing GCaMP and C1V1. Cells 1–5 and the target cell (TC) correspond to the traces shown on the right. Optical stimulation of the TC induces network-level changes in the place-cell firing of other neurons, causing some neurons to also fire within the imposed place field of the TC (cells 1 and 2), but not other cells (cells 3–5) (right panel). d | Left panel: integration of optogenetics and activity-dependent immediate-early gene labelling techniques in medial prefrontal cortex (mPFC) populations is shown. Middle panel: compared with the control response in the home cage (fosCh home cage), stimulation of mPFC neurons that had been previously activated by exposure to footshock was sufficient to drive place aversion, whereas stimulation of PFC neurons that had been previously activated by cocaine exposure drove place preference. Right panel: methodologies that enable clearing of brain lipid content after covalent hybridization of other biomolecules to a hydrogel have revealed distinct cell typology and projection patterning between cocaine-activated neurons and footshock-activated neurons. Cocaine-activated neurons (cells expressing the gene neuronal PAS domain-containing protein 4 (Npas4+)) were revealed to have more dense projections to the NAc, whereas footshock-activated neurons project more densely to the lateral habenula (LHb). Part a is adapted with permission from REF. , Macmillan Publishers Limited. Part b is adapted with permission from REF. , Macmillan Publishers Limited. Part c is adapted with permission from REF. , Macmillan Publishers Limited. Part d is adapted with permission from REF. , Elsevier.

Similar articles

Cited by

References

    1. Deisseroth K. Optogenetics: 10 years of microbial opsins in neuroscience. Nat Neurosci. 2015;18:1213–1225. This recent review covers the history and developments of optogenetics over the past 10 years and addresses potential limitations and standards of practice for application. - PMC - PubMed
    1. Grosenick L, Marshel JH, Deisseroth K. Closed-loop and activity-guided optogenetic control. Neuron. 2015;86:106–139. - PMC - PubMed
    1. Zhang F, et al. Optogenetic interrogation of neural circuits: technology for probing mammalian brain structures. Nat Protoc. 2010;5:439–456. - PMC - PubMed
    1. Aravanis AM, et al. An optical neural interface: in vivo control of rodent motor cortex with integrated fiberoptic and optogenetic technology. J Neural Eng. 2007;4:S143–S156. - PubMed
    1. Warden MR, Cardin JA, Deisseroth K. Optical neural interfaces. Annu Rev Biomed Eng. 2014;16:103–129. - PMC - PubMed