

Evaluating Intervention Programs with a Pretest-Posttest Design: A Structural Equation Modeling Approach
- PMID: 28303110
- PMCID: PMC5332425
- DOI: 10.3389/fpsyg.2017.00223
Evaluating Intervention Programs with a Pretest-Posttest Design: A Structural Equation Modeling Approach
Abstract
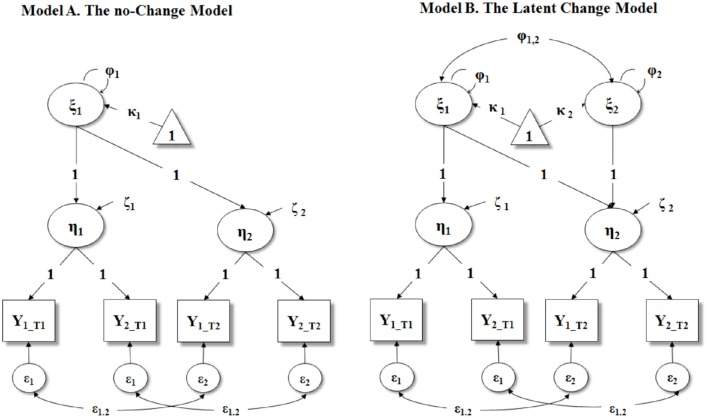
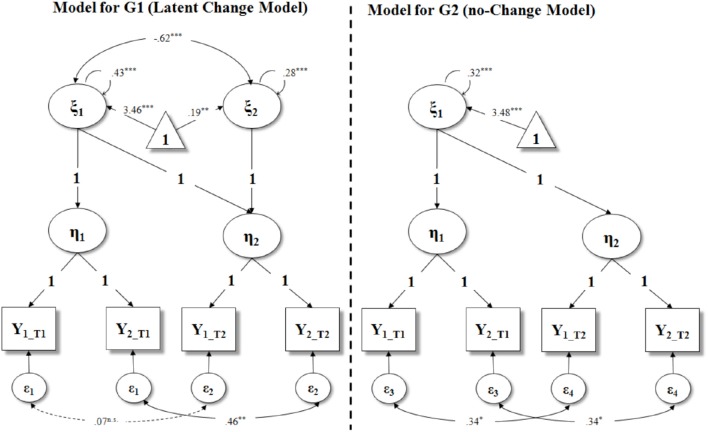
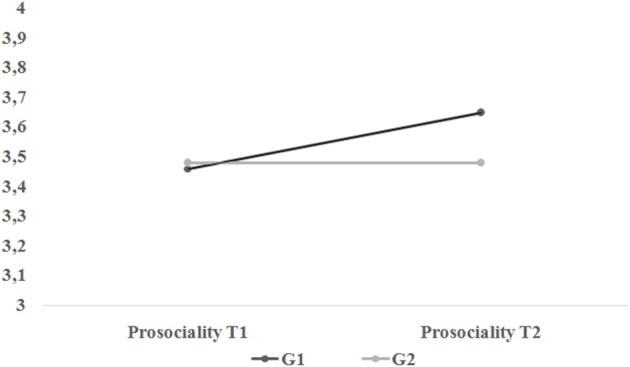
A common situation in the evaluation of intervention programs is the researcher's possibility to rely on two waves of data only (i.e., pretest and posttest), which profoundly impacts on his/her choice about the possible statistical analyses to be conducted. Indeed, the evaluation of intervention programs based on a pretest-posttest design has been usually carried out by using classic statistical tests, such as family-wise ANOVA analyses, which are strongly limited by exclusively analyzing the intervention effects at the group level. In this article, we showed how second order multiple group latent curve modeling (SO-MG-LCM) could represent a useful methodological tool to have a more realistic and informative assessment of intervention programs with two waves of data. We offered a practical step-by-step guide to properly implement this methodology, and we outlined the advantages of the LCM approach over classic ANOVA analyses. Furthermore, we also provided a real-data example by re-analyzing the implementation of the Young Prosocial Animation, a universal intervention program aimed at promoting prosociality among youth. In conclusion, albeit there are previous studies that pointed to the usefulness of MG-LCM to evaluate intervention programs (Muthén and Curran, 1997; Curran and Muthén, 1999), no previous study showed that it is possible to use this approach even in pretest-posttest (i.e., with only two time points) designs. Given the advantages of latent variable analyses in examining differences in interindividual and intraindividual changes (McArdle, 2009), the methodological and substantive implications of our proposed approach are discussed.
Keywords: experimental design; intervention; latent variables; multiple group latent curve model; pretest-posttest; second order latent curve model; structural equation modeling.
Figures
References
-
- Alessandri G., Vecchione M., Caprara G. V., Letzring T. D. (2012). The ego resiliency scale revised: a crosscultural study in Italy, Spain, and the United States. Eur. J. Psychol. Assess. 28, 139–146. 10.1027/1015-5759/a000102 - DOI
-
- Bandalos D. L., Leite W. (2013). Use of Monte Carlo studies in structural equation modeling research, in Structural Equation Modeling: A Second Course, 2nd Edn., eds Hancock G. R., Mueller R. O. (Charlotte, NC: Information Age Publishing; ), 625–666.
LinkOut - more resources
Full Text Sources
Other Literature Sources
Medical