

Identifying the Origin of Effects of Contralateral Noise on Transient Evoked Otoacoustic Emissions in Unanesthetized Mice
- PMID: 28303411
- PMCID: PMC5532179
- DOI: 10.1007/s10162-017-0616-x
Identifying the Origin of Effects of Contralateral Noise on Transient Evoked Otoacoustic Emissions in Unanesthetized Mice
Abstract
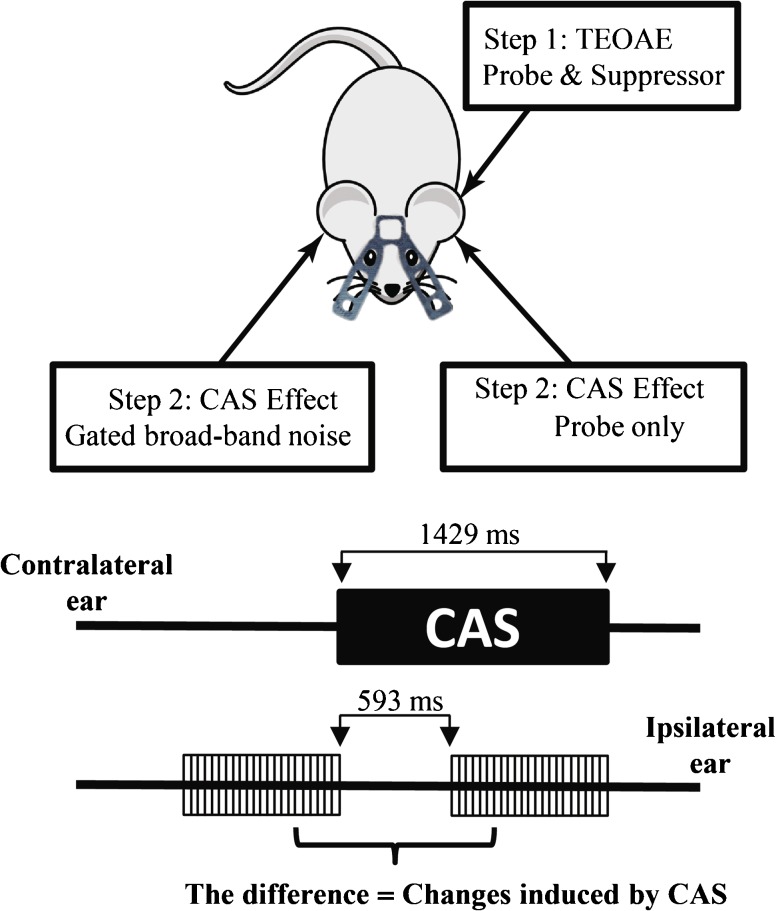
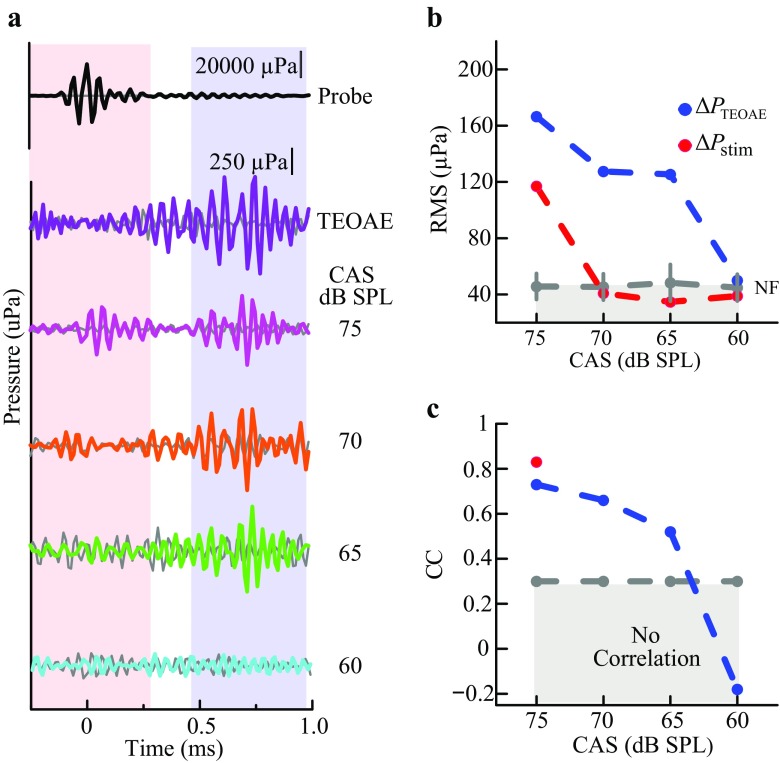
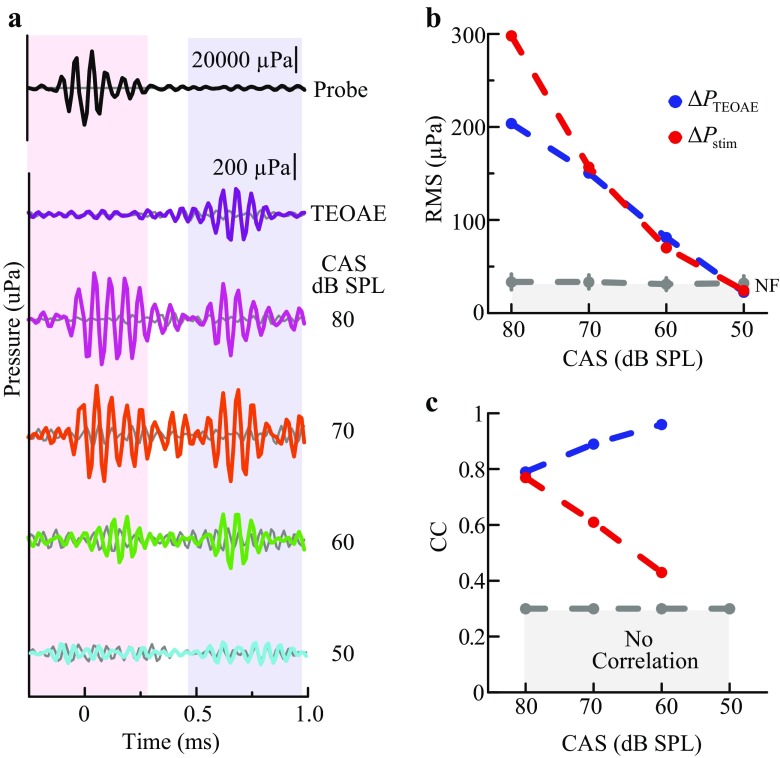
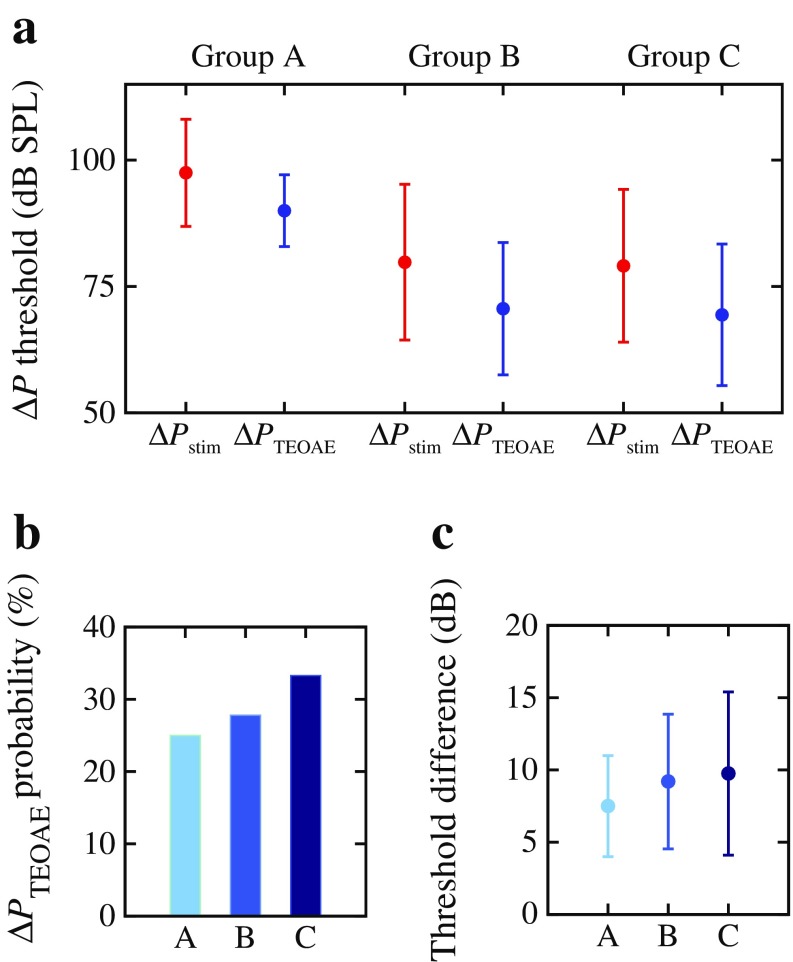
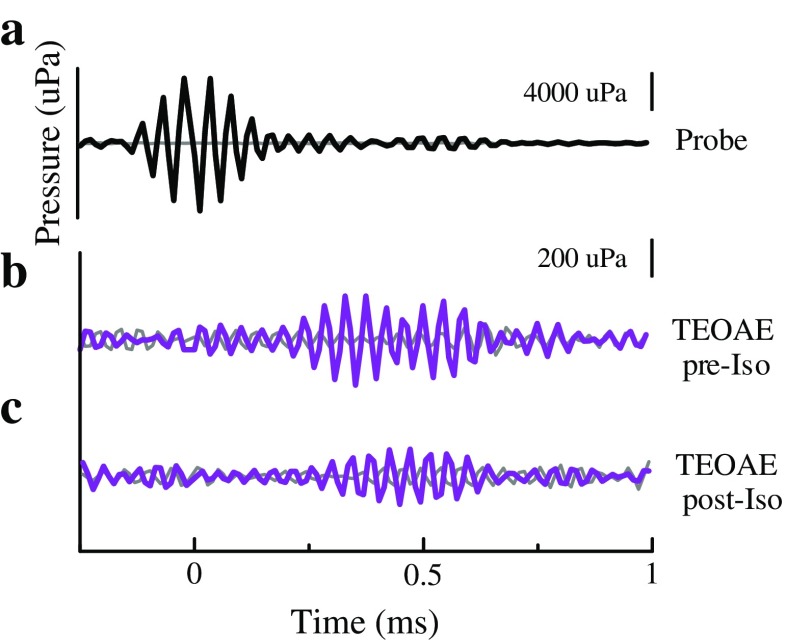
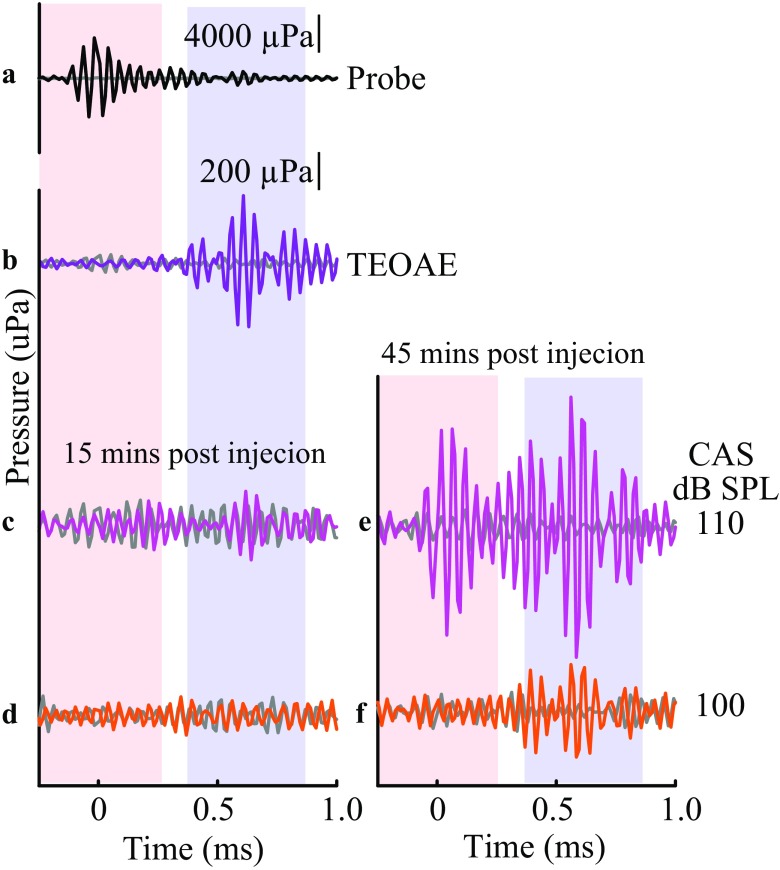
Descending neural pathways in the mammalian auditory system are known to modulate the function of the peripheral auditory system. These pathways include the medial olivocochlear (MOC) efferent innervation to outer hair cells (OHCs) and the acoustic reflex pathways mediating middle ear muscle (MEM) contractions. Based on measurements in humans (Marks and Siegel, companion paper), we applied a sensitive method to attempt to differentiate MEM and MOC reflexes using contralateral acoustic stimulation in mice under different levels of anesthesia. Separation of these effects is based on the knowledge that OHC-generated transient evoked otoacoustic emissions (TEOAE) are delayed relative to the stimulus, and that the MOC reflex affects the emission through its innervation of OHC. In contrast, the MEM-mediated changes in middle ear reflectance alter both the stimulus (with a short delay) and the emission. Using this approach, time averages to transient stimuli were evaluated to determine if thresholds for a contralateral effect on the delayed emission, indicating potential MOC activation, could be observed in the absence of a change in the stimulus pressure. This outcome was not observed in the majority of cases. There were also no statistically significant differences between MEM and putative MOC thresholds, and variability was high for both thresholds regardless of anesthesia level. Since the two reflex pathways could not be differentiated on the basis of activation thresholds, it was concluded that the MEM reflex dominates changes in TEOAEs induced by contralateral noise. This result complicates the identification of purely MOC-induced changes on OAEs in mice unless the MEM reflex is inactivated surgically or pharmacologically.
Keywords: Contralateral noise; Olivocochlear; Otoacoustic emissions.
Figures
Similar articles
-
Differentiating Middle Ear and Medial Olivocochlear Effects on Transient-Evoked Otoacoustic Emissions.J Assoc Res Otolaryngol. 2017 Aug;18(4):529-542. doi: 10.1007/s10162-017-0621-0. Epub 2017 Apr 21. J Assoc Res Otolaryngol. 2017. PMID: 28432471 Free PMC article. Clinical Trial.
-
Contralateral suppression of distortion product otoacoustic emissions and the middle-ear muscle reflex in human ears.Hear Res. 2008 Mar;237(1-2):66-75. doi: 10.1016/j.heares.2007.12.004. Epub 2007 Dec 28. Hear Res. 2008. PMID: 18258398
-
Simultaneous measurement of noise-activated middle-ear muscle reflex and stimulus frequency otoacoustic emissions.J Assoc Res Otolaryngol. 2006 Jun;7(2):125-39. doi: 10.1007/s10162-006-0028-9. Epub 2006 Mar 28. J Assoc Res Otolaryngol. 2006. PMID: 16568366 Free PMC article.
-
Olivocochlear efferents: anatomy, physiology, function, and the measurement of efferent effects in humans.Ear Hear. 2006 Dec;27(6):589-607. doi: 10.1097/01.aud.0000240507.83072.e7. Ear Hear. 2006. PMID: 17086072 Review.
-
The First Jerger Lecture. Contralateral suppression of otoacoustic emissions: an index of the function of the medial olivocochlear system.Otolaryngol Head Neck Surg. 1994 Jan;110(1):3-21. doi: 10.1177/019459989411000102. Otolaryngol Head Neck Surg. 1994. PMID: 8290299 Review.
Cited by
-
Effects of cochlear synaptopathy on middle-ear muscle reflexes in unanesthetized mice.Hear Res. 2018 Jun;363:109-118. doi: 10.1016/j.heares.2018.03.012. Epub 2018 Mar 13. Hear Res. 2018. PMID: 29598837 Free PMC article.
-
Olivocochlear Changes Associated With Aging Predominantly Affect the Medial Olivocochlear System.Front Neurosci. 2021 Sep 3;15:704805. doi: 10.3389/fnins.2021.704805. eCollection 2021. Front Neurosci. 2021. PMID: 34539335 Free PMC article.
-
Olivocochlear Efferents in Animals and Humans: From Anatomy to Clinical Relevance.Front Neurol. 2018 Mar 26;9:197. doi: 10.3389/fneur.2018.00197. eCollection 2018. Front Neurol. 2018. PMID: 29632514 Free PMC article. Review.
-
Minimal Effects of Age and Exposure to a Noisy Environment on Hearing in Alpha9 Nicotinic Receptor Knockout Mice.Front Neurosci. 2017 Jun 2;11:304. doi: 10.3389/fnins.2017.00304. eCollection 2017. Front Neurosci. 2017. PMID: 28626386 Free PMC article.
-
Differentiating Middle Ear and Medial Olivocochlear Effects on Transient-Evoked Otoacoustic Emissions.J Assoc Res Otolaryngol. 2017 Aug;18(4):529-542. doi: 10.1007/s10162-017-0621-0. Epub 2017 Apr 21. J Assoc Res Otolaryngol. 2017. PMID: 28432471 Free PMC article. Clinical Trial.
References
Publication types
MeSH terms
Grants and funding
LinkOut - more resources
Full Text Sources
Other Literature Sources
