. 2017 Mar 17:7:44047.
doi: 10.1038/srep44047.

Sprint Interval Training Induces A Sexual Dimorphism but does not Improve Peak Bone Mass in Young and Healthy Mice

Affiliations

Sprint Interval Training Induces A Sexual Dimorphism but does not Improve Peak Bone Mass in Young and Healthy Mice

Kathrin Koenen et al. Sci Rep. .

Abstract

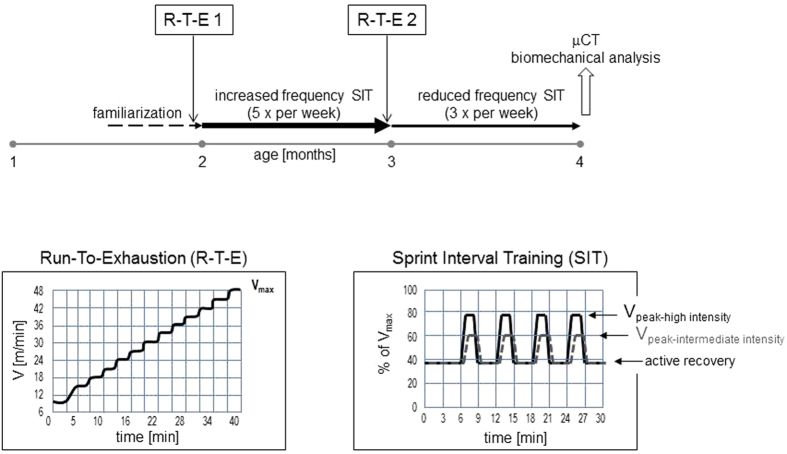
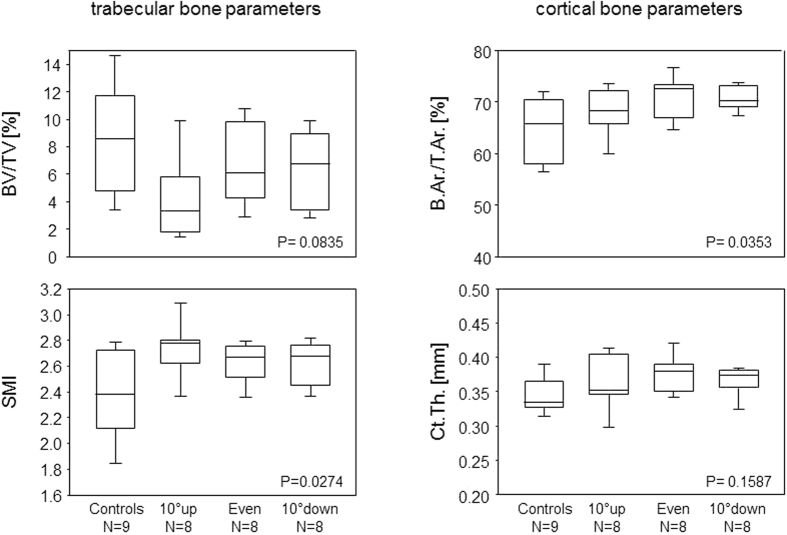
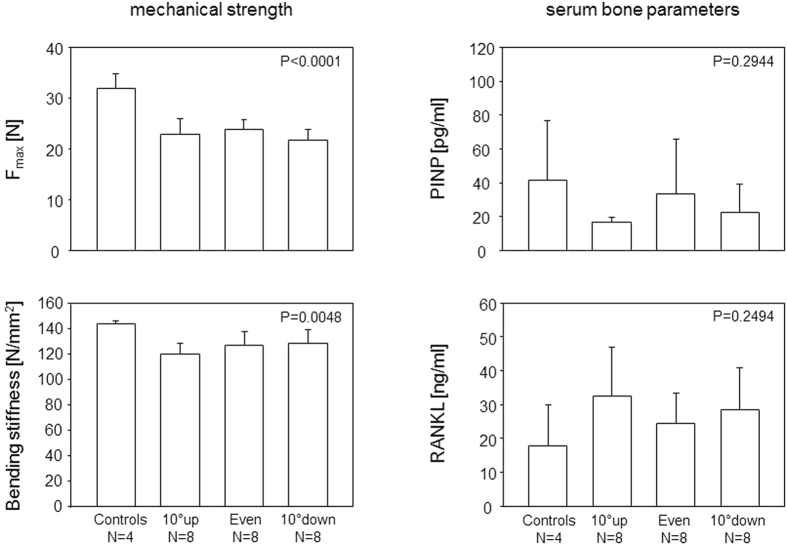
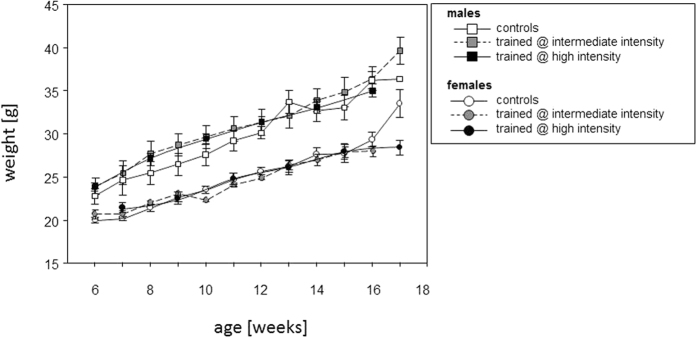
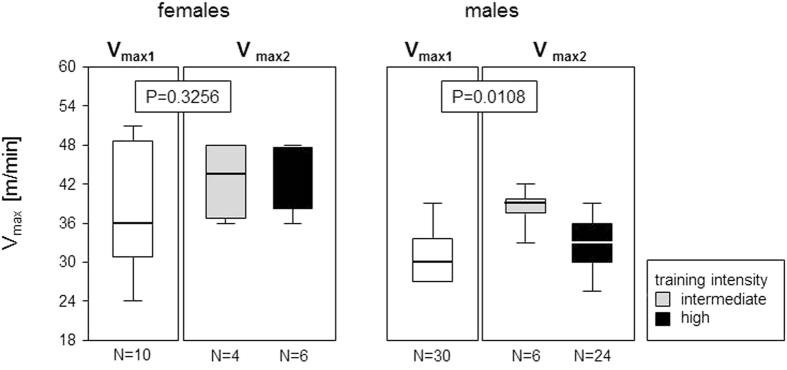
Elevated peak bone mass in early adulthood reduces the risk for osteoporotic fractures at old age. As sports participation has been correlated with elevated peak bone masses, we aimed to establish a training program that would efficiently stimulate bone accrual in healthy young mice. We combined voluntary treadmill running with sprint interval training modalities that were tailored to the individual performance limits and were of either high or intermediate intensity. Adolescent male and female STR/ort mice underwent 8 weeks of training before the hind legs were analyzed for cortical and trabecular bone parameters and biomechanical strength. Sprint interval training led to increased running speeds, confirming an efficient training. However, males and females responded differently. The males improved their running speeds in response to intermediate intensities only and accrued cortical bone at the expense of mechanical strength. High training intensities induced a significant loss of trabecular bone. The female bones showed neither adverse nor beneficial effects in response to either training intensities. Speculations about the failure to improve geometric alongside mechanical bone properties include the possibility that our training lacked sufficient axial loading, that high cardio-vascular strains adversely affect bone growth and that there are physiological limits to bone accrual.


Conflict of interest statement

The authors declare no competing financial interests.

Figures

Figure 1
Figure 1. Training Programs.
Treadmill training consisted of two weeks of familiarization followed by 4 weeks of increased frequency sprint interval training (five times per week) and another four weeks of reduced frequency sprint interval training (three times per week). The time line is depicted by horizontal arrows. At the end of the familiarization phase and again at the end of the four weeks of increased frequency sprint interval training, all mice took a run-to-exhaustion test in order to determine their individual performance limit. After completion of the eight weeks of sprint interval training at the age of four months, mice were sacrificed and bones of the left hind limbs were prepared for micro-computed tomography (μCT), the right femora were prepared for three-point-bending assays. Mice were weighed at entry into the familiarization phase and every week thereafter. Inserts illustrate the ramp-up run-to-exhaustion test yielding the maximal velocity (Vmax) each mouse was capable of running (left insert) and the sprint interval training with its peak velocities (Vpeak) for either high or intermediate intensity as well as active recovery phases (right insert).
Figure 2
Figure 2. High intensity sprint interval training led to reduced trabecular and increased cortical bone mass in male mice.
Box plots show trabecular and cortical bone parameters of the femora of male mice after eight weeks of high intensity sprint interval training. 10° up, even and 10° down indicate the inclination of the treadmill. P-values give the results of One-Way ANOVA. P-values < 0.05 are considered significant. The boxes represent medians as well as upper and lower quartiles and the whiskers indicate 90th and 10th percentiles, respectively. BV/TV: bone volume/tissue volume; SMI: structure model index: B.Ar./T.Ar.: bone area/tissue area; Ct.Th.: cortical thickness.
Figure 3
Figure 3. Increased femoral cortical bone mass in male mice having completed high intensity sprint interval training was paralleled by reduced mechanical strength.
Bars show the means and SEM for the ultimate strength required to break the right femora and for the bending stiffness (left panels) and serum PINP and RANKL concentrations (right panels). 10° up, even and 10° down indicate the inclination of the treadmill. P-values give the results of One-Way ANOVA. P-values < 0.05 are considered significant.
Figure 4
Figure 4. Sprint interval training promoted normal physiological development.
Figure 4 shows the weight curves of mice that underwent treadmill training (grey symbols for the intermediate intensity trained mice, black symbols for the high intensity trained). The weights of non-trained age- and sex-matched control mice are interspersed (open symbols). Means and SEM are presented. Note, that mice entered the experiment at either 6 or seven weeks of age, so that experiments were terminated at either 16 or 17 weeks of age.
Figure 5
Figure 5. Sprint interval training led to increased running speeds.
Box plots show the maximal velocities (Vmax) that mice ran voluntarily during the ramp-up run-to-exhaustion tests (R-T-E). White boxes represent the Vmax1 before commencement of any sprint interval training. Grey (intermediate intensity) and black (high intensity) boxes represent the Vmax2 after completion of four weeks of increased frequency training. The boxes represent medians as well as upper and lower quartiles and the whiskers indicate 90th and 10th percentiles, respectively. **Indicate P values < 0.01 resulting from Mann-Whitney U tests.

Similar articles

Cited by

References

    1. Tenforde A. S. & Fredericson M. Influence of sports participation on bone health in the young athlete: a review of the literature. PM R 3, 861–867, doi: 10.1016/j.pmrj.2011.05.019 (2011). - DOI - PubMed
    1. Harvey N., Dennison E. & Cooper C. Osteoporosis: a lifecourse approach. J Bone Miner Res 29, 1917–1925, doi: 10.1002/jbmr.2286 (2014). - DOI - PubMed
    1. Mitchell P. J., Cooper C., Dawson-Hughes B., Gordon C. M. & Rizzoli R. Life-course approach to nutrition. Osteoporos Int 26, 2723–2742, doi: 10.1007/s00198-015-3288-6 (2015). - DOI - PMC - PubMed
    1. Johnell O. & Kanis J. A. An estimate of the worldwide prevalence and disability associated with osteoporotic fractures. Osteoporos Int 17, 1726–1733, doi: 10.1007/s00198-006-0172-4 (2006). - DOI - PubMed
    1. Burge R. et al.. Incidence and economic burden of osteoporosis-related fractures in the United States, 2005–2025. J Bone Miner Res 22, 465–475, doi: 10.1359/jbmr.061113 (2007). - DOI - PubMed

LinkOut - more resources