

Partitioning of red blood cell aggregates in bifurcating microscale flows
- PMID: 28303921
- PMCID: PMC5355999
- DOI: 10.1038/srep44563
Partitioning of red blood cell aggregates in bifurcating microscale flows
Abstract
Microvascular flows are often considered to be free of red blood cell aggregates, however, recent studies have demonstrated that aggregates are present throughout the microvasculature, affecting cell distribution and blood perfusion. This work reports on the spatial distribution of red blood cell aggregates in a T-shaped bifurcation on the scale of a large microvessel. Non-aggregating and aggregating human red blood cell suspensions were studied for a range of flow splits in the daughter branches of the bifurcation. Aggregate sizes were determined using image processing. The mean aggregate size was marginally increased in the daughter branches for a range of flow rates, mainly due to the lower shear conditions and the close cell and aggregate proximity therein. A counterintuitive decrease in the mean aggregate size was apparent in the lower flow rate branches. This was attributed to the existence of regions depleted by aggregates of certain sizes in the parent branch, and to the change in the exact flow split location in the T-junction with flow ratio. The findings of the present investigation may have significant implications for microvascular flows and may help explain why the effects of physiological RBC aggregation are not deleterious in terms of in vivo vascular resistance.
Conflict of interest statement
The authors declare no competing financial interests.
Figures
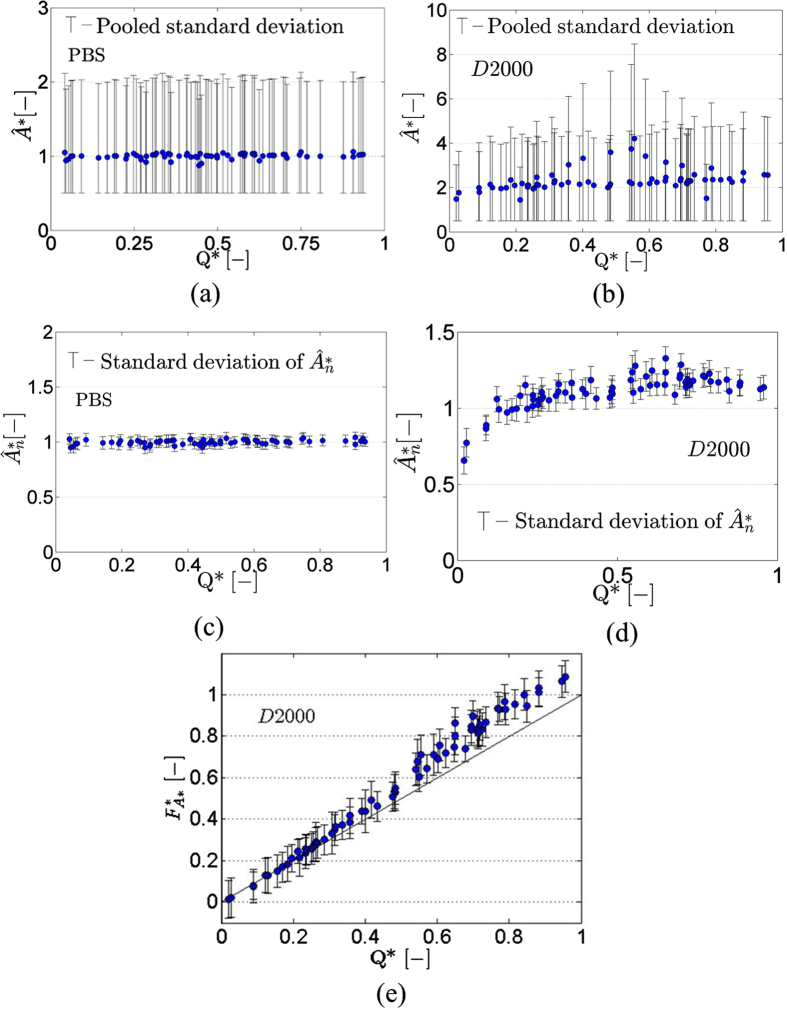
 ) and
) and  values based on 400 images against Q* for the PBS case. (b) Ensemble averaged values (
 ) with pooled standard deviation for the D2000 case. (c) Ensemble averaged values
  (PBS) obtained by normalising
  by the values in parent branch (the standard deviation of
  (n = 400) is also shown). The lower limit in the data of
  in (a) was 0.5 due to noise reduction in the data. (d) Ensemble averaged (
 ) values of aggregate size
  plotted against Q* (D2000 cases); the data is normalised by the
  values in the parent branch. Data below Q* = 0.5 correspond to the right daughter branch and above Q* = 0.5 to the left daughter branch. The standard deviation of
  is also included. (e) Size-flow parameter FA* = Q*A* against Q* as an index of the flow preference of different aggregate size.
Similar articles
-
Red blood cell aggregate flux in a bifurcating microchannel.Med Eng Phys. 2017 Oct;48:23-30. doi: 10.1016/j.medengphy.2017.04.007. Epub 2017 May 9. Med Eng Phys. 2017. PMID: 28499813
-
Red blood cell aggregates and their effect on non-Newtonian blood viscosity at low hematocrit in a two-fluid low shear rate microfluidic system.PLoS One. 2018 Jul 19;13(7):e0199911. doi: 10.1371/journal.pone.0199911. eCollection 2018. PLoS One. 2018. PMID: 30024907 Free PMC article.
-
Conductometric study of shear-dependent processes in red cell suspensions. II. Transient cross-stream hematocrit distribution.Biorheology. 2004;41(1):29-43. Biorheology. 2004. PMID: 14967888
-
Erythrocyte aggregation: basic aspects and clinical importance.Clin Hemorheol Microcirc. 2013;53(1-2):23-37. doi: 10.3233/CH-2012-1573. Clin Hemorheol Microcirc. 2013. PMID: 22975932 Review.
-
Dynamic structure of blood flow in microvessels.Microcirc Endothelium Lymphatics. 1991;7(1-3):3-49. Microcirc Endothelium Lymphatics. 1991. PMID: 1762608 Review.
Cited by
-
Red blood cell lingering modulates hematocrit distribution in the microcirculation.Biophys J. 2023 Apr 18;122(8):1526-1537. doi: 10.1016/j.bpj.2023.03.020. Epub 2023 Mar 17. Biophys J. 2023. PMID: 36932676 Free PMC article.
-
Development of an Optical Method for the Evaluation of Whole Blood Coagulation.Biosensors (Basel). 2021 Apr 9;11(4):113. doi: 10.3390/bios11040113. Biosensors (Basel). 2021. PMID: 33918734 Free PMC article.
-
Investigating the Interaction Between Circulating Tumor Cells and Local Hydrodynamics via Experiment and Simulations.Cell Mol Bioeng. 2020 Oct 21;13(5):527-540. doi: 10.1007/s12195-020-00656-7. eCollection 2020 Oct. Cell Mol Bioeng. 2020. PMID: 33184581 Free PMC article.
-
Microfluidic-Based Biosensor for Blood Viscosity and Erythrocyte Sedimentation Rate Using Disposable Fluid Delivery System.Micromachines (Basel). 2020 Feb 20;11(2):215. doi: 10.3390/mi11020215. Micromachines (Basel). 2020. PMID: 32093288 Free PMC article.
-
Partitioning of dense RBC suspensions in single microfluidic bifurcations: role of cell deformability and bifurcation angle.Sci Rep. 2024 Jan 4;14(1):535. doi: 10.1038/s41598-023-49849-w. Sci Rep. 2024. PMID: 38177195 Free PMC article.
References
-
- Popel A. S., Johnson P. C., Kameneva M. V. & Wild M. A. Capacity for red blood cell aggregation is higher in athletic mammalian species than in sedentary species. J. Appl. Physiol. 77, 1790–1794 (1994). - PubMed
-
- Baskurt O. K. & Meiselman H. J. Blood Rheology and Hemodynamics. Semin. Thromb. Hemost. 29, 435–450 (2003). - PubMed
MeSH terms
LinkOut - more resources
Full Text Sources
Other Literature Sources
