

Identification of the metabolic alterations associated with the multidrug resistant phenotype in cancer and their intercellular transfer mediated by extracellular vesicles
- PMID: 28303926
- PMCID: PMC5356019
- DOI: 10.1038/srep44541
Identification of the metabolic alterations associated with the multidrug resistant phenotype in cancer and their intercellular transfer mediated by extracellular vesicles
Abstract
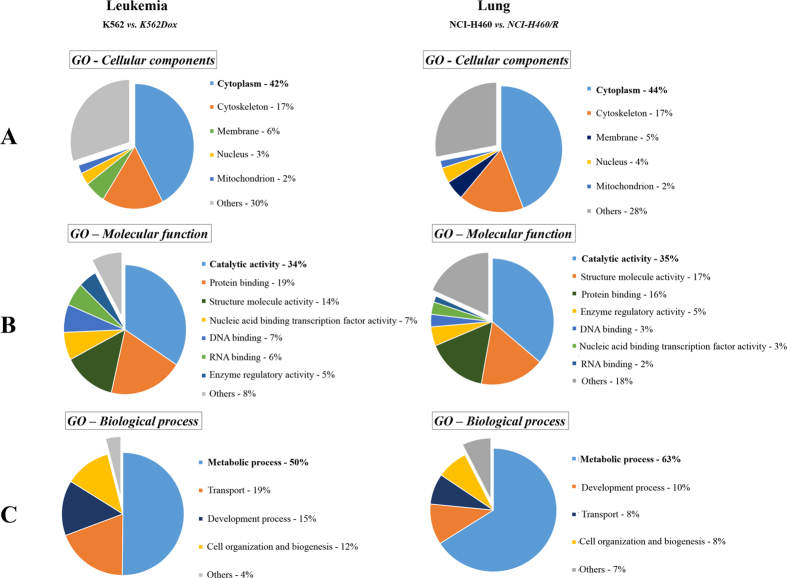
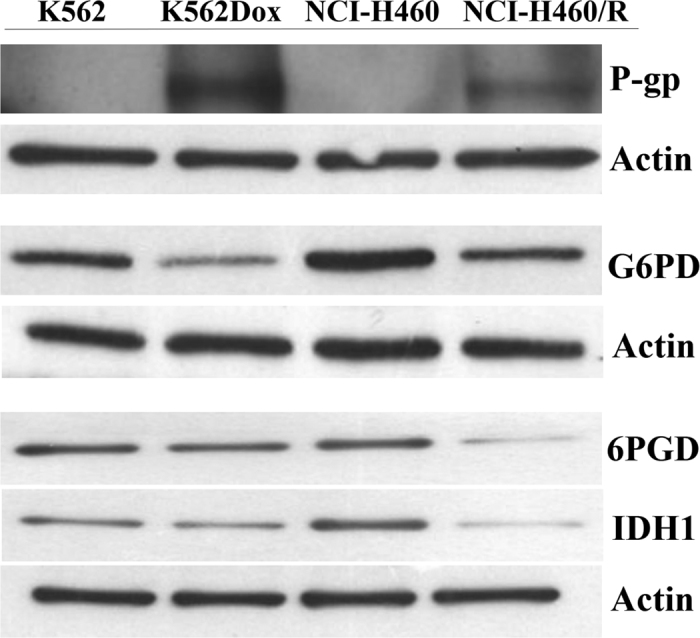
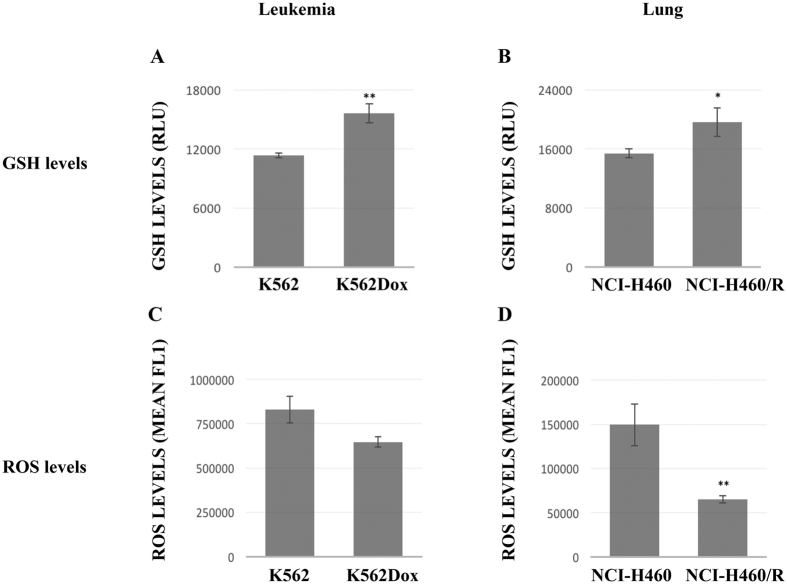
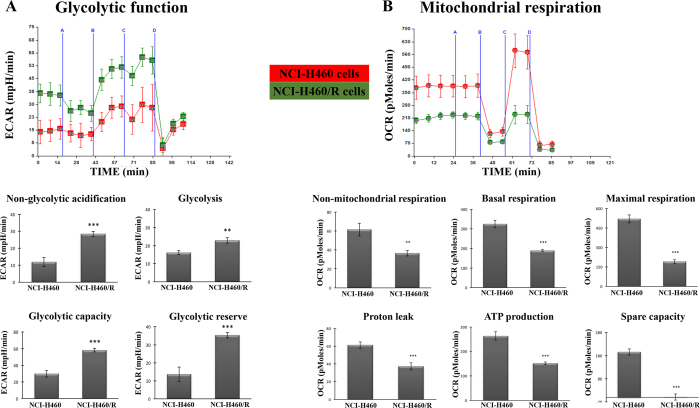
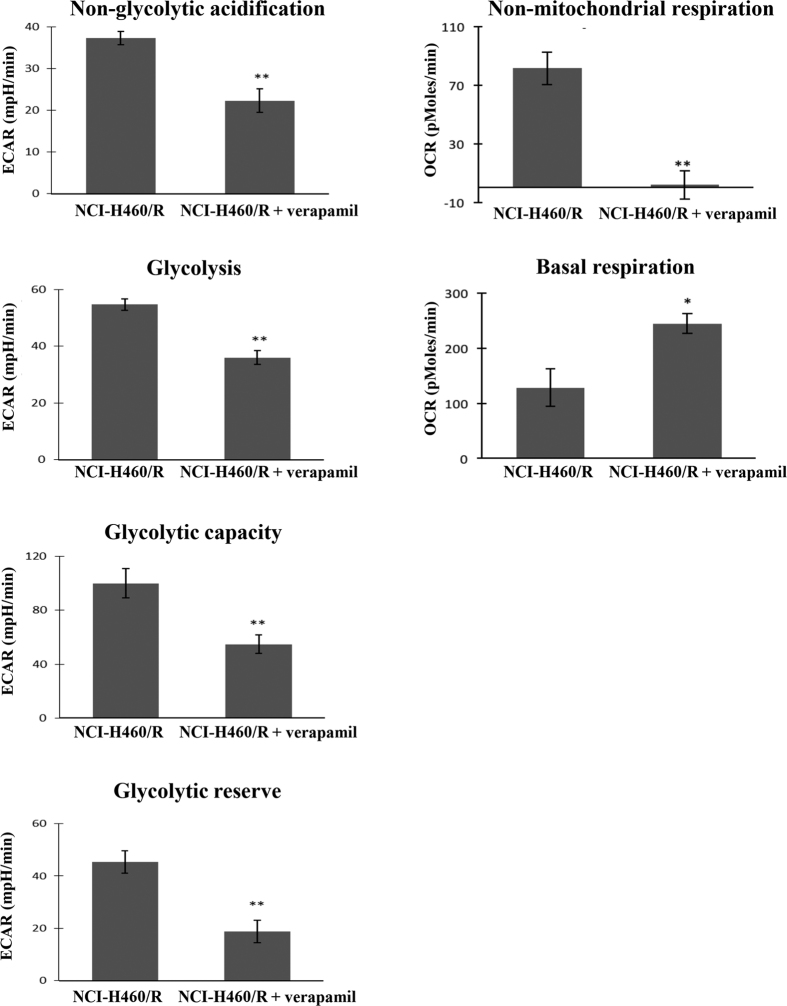
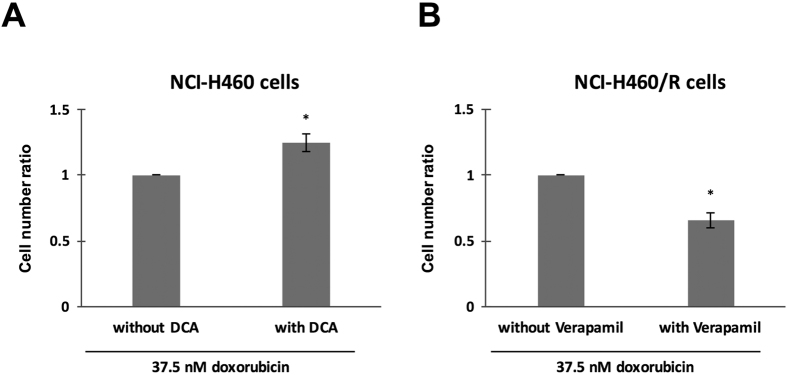
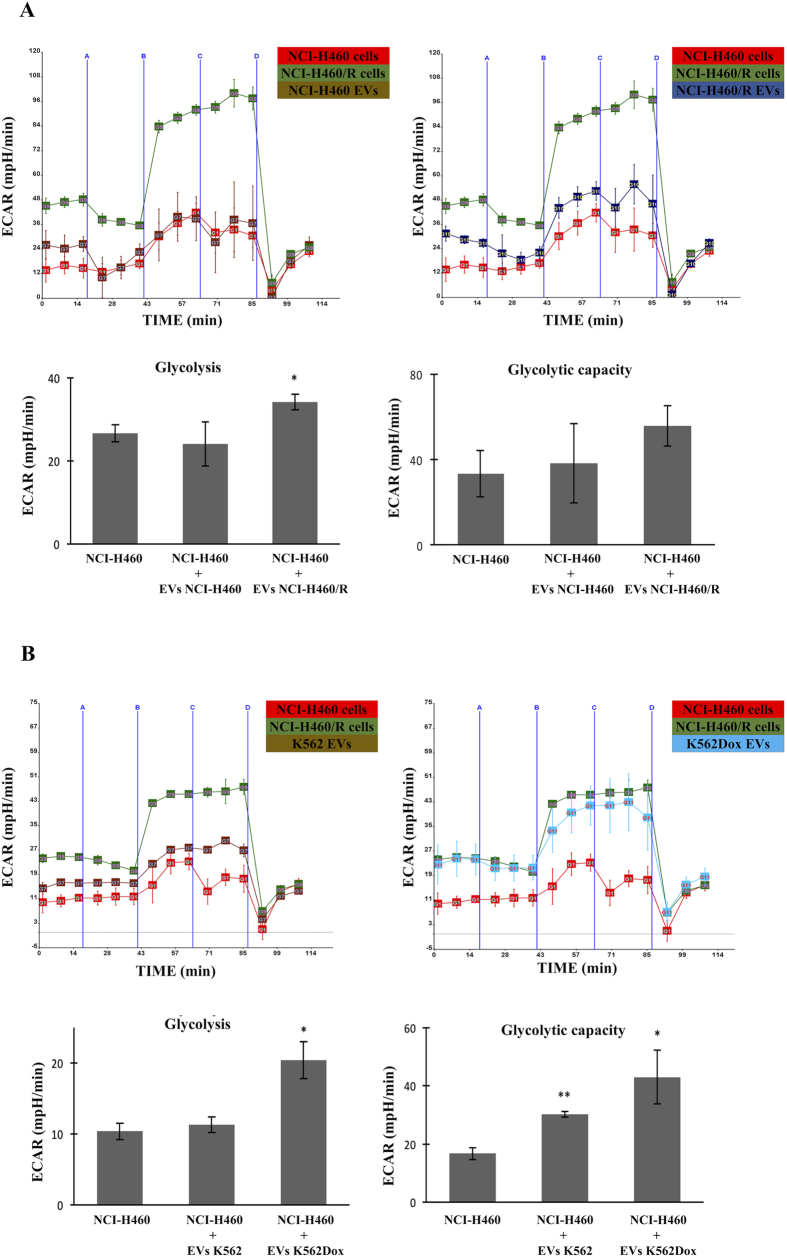
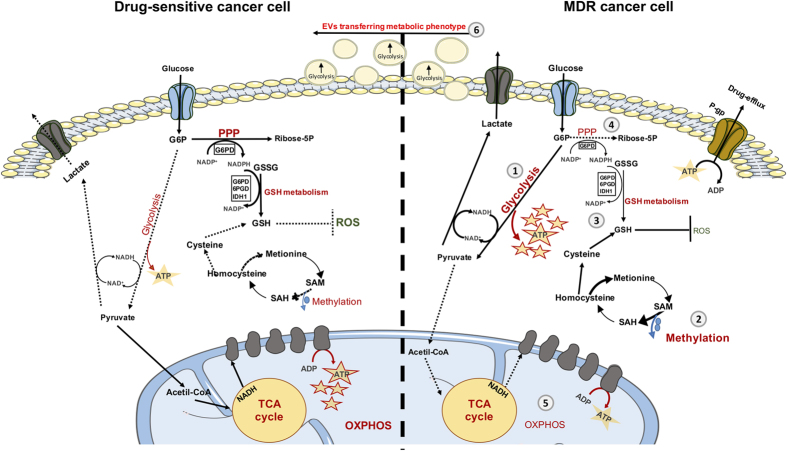
Multidrug resistance (MDR) is a serious obstacle to efficient cancer treatment. Overexpression of P-glycoprotein (P-gp) plays a significant role in MDR. Recent studies proved that targeting cellular metabolism could sensitize MDR cells. In addition, metabolic alterations could affect the extracellular vesicles (EVs) cargo and release. This study aimed to: i) identify metabolic alterations in P-gp overexpressing cells that could be involved in the development of MDR and, ii) identify a potential role for the EVs in the acquisition of the MDR. Two different pairs of MDR and their drug-sensitive counterpart cancer cell lines were used. Our results showed that MDR (P-gp overexpressing) cells have a different metabolic profile from their drug-sensitive counterparts, demonstrating decreases in the pentose phosphate pathway and oxidative phosphorylation rate; increases in glutathione metabolism and glycolysis; and alterations in the methionine/S-adenosylmethionine pathway. Remarkably, EVs from MDR cells were capable of stimulating a metabolic switch in the drug-sensitive cancer cells, towards a MDR phenotype. In conclusion, obtained results contribute to the growing knowledge about metabolic alterations in MDR cells and the role of EVs in the intercellular transfer of MDR. The specific metabolic alterations identified in this study may be further developed as targets for overcoming MDR.
Conflict of interest statement
The authors declare no competing financial interests.
Figures

Similar articles
-
Multidrug resistant tumour cells shed more microvesicle-like EVs and less exosomes than their drug-sensitive counterpart cells.Biochim Biophys Acta. 2016 Mar;1860(3):618-27. doi: 10.1016/j.bbagen.2015.12.011. Epub 2015 Dec 17. Biochim Biophys Acta. 2016. PMID: 26708992
-
Reversal of multidrug resistance by Marsdenia tenacissima and its main active ingredients polyoxypregnanes.J Ethnopharmacol. 2017 May 5;203:110-119. doi: 10.1016/j.jep.2017.03.051. Epub 2017 Mar 28. J Ethnopharmacol. 2017. PMID: 28363522
-
Asclepiasterol, a novel C21 steroidal glycoside derived from Asclepias curassavica, reverses tumor multidrug resistance by down-regulating P-glycoprotein expression.Oncotarget. 2016 May 24;7(21):31466-83. doi: 10.18632/oncotarget.8965. Oncotarget. 2016. PMID: 27129170 Free PMC article.
-
Relevance of multidrug resistance in the age of targeted therapy.Curr Opin Drug Discov Devel. 2009 Mar;12(2):246-52. Curr Opin Drug Discov Devel. 2009. PMID: 19333870 Review.
-
Microparticles and their emerging role in cancer multidrug resistance.Cancer Treat Rev. 2012 May;38(3):226-34. doi: 10.1016/j.ctrv.2011.06.005. Epub 2011 Jul 14. Cancer Treat Rev. 2012. PMID: 21757296 Review.
Cited by
-
Visualizing Extracellular Vesicles and Their Function in 3D Tumor Microenvironment Models.Int J Mol Sci. 2021 Apr 30;22(9):4784. doi: 10.3390/ijms22094784. Int J Mol Sci. 2021. PMID: 33946403 Free PMC article. Review.
-
The "Vesicular Intelligence" Strategy of Blood Cancers.Genes (Basel). 2021 Mar 13;12(3):416. doi: 10.3390/genes12030416. Genes (Basel). 2021. PMID: 33805807 Free PMC article. Review.
-
Detection of Measurable Residual Disease Biomarkers in Extracellular Vesicles from Liquid Biopsies of Multiple Myeloma Patients-A Proof of Concept.Int J Mol Sci. 2022 Nov 8;23(22):13686. doi: 10.3390/ijms232213686. Int J Mol Sci. 2022. PMID: 36430163 Free PMC article.
-
Inhibition of HIF1α-Dependent Upregulation of Phospho-l-Plastin Resensitizes Multiple Myeloma Cells to Frontline Therapy.Int J Mol Sci. 2018 May 23;19(6):1551. doi: 10.3390/ijms19061551. Int J Mol Sci. 2018. PMID: 29882856 Free PMC article.
-
Chemosensitizing effect of pentoxifylline in sensitive and multidrug-resistant non-small cell lung cancer cells.Cancer Drug Resist. 2024 May 20;7:19. doi: 10.20517/cdr.2024.04. eCollection 2024. Cancer Drug Resist. 2024. PMID: 38835347 Free PMC article.
References
-
- Larsen A. K., Escargueil A. E. & Skladanowski A. Resistance mechanisms associated with altered intracellular distribution of anticancer agents. Pharmacol Ther 85, 217–229 (2000). - PubMed
Publication types
MeSH terms
Substances
LinkOut - more resources
Full Text Sources
Other Literature Sources
Miscellaneous
