. 2017 Mar:17:223-236.
doi: 10.1016/j.ebiom.2017.02.025. Epub 2017 Mar 1.

Identification of an atypical etiological head and neck squamous carcinoma subtype featuring the CpG island methylator phenotype

Affiliations

Identification of an atypical etiological head and neck squamous carcinoma subtype featuring the CpG island methylator phenotype

K Brennan et al. EBioMedicine. 2017 Mar.

Abstract

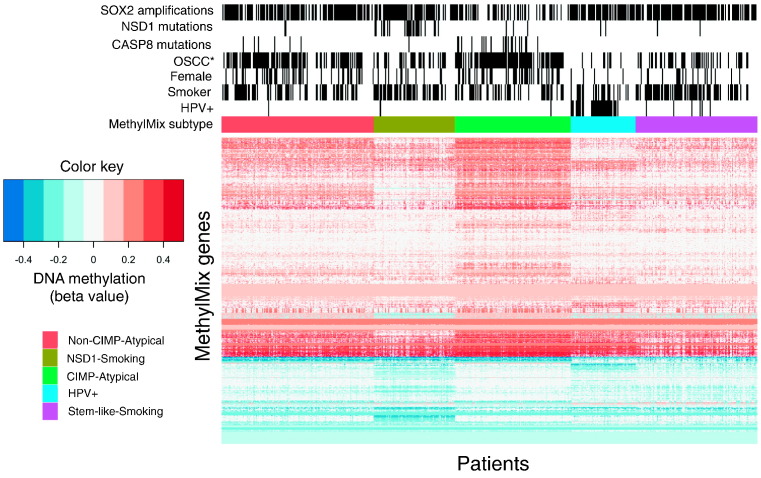
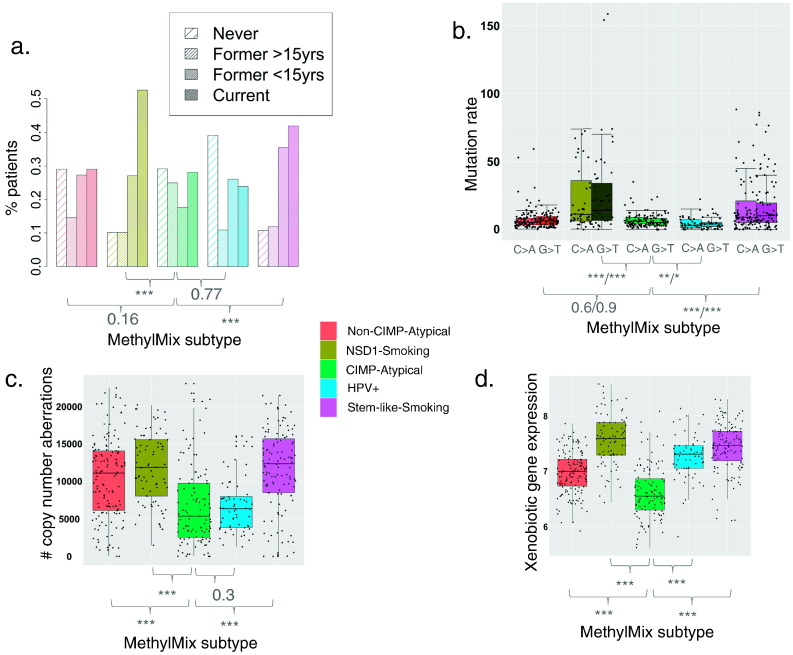
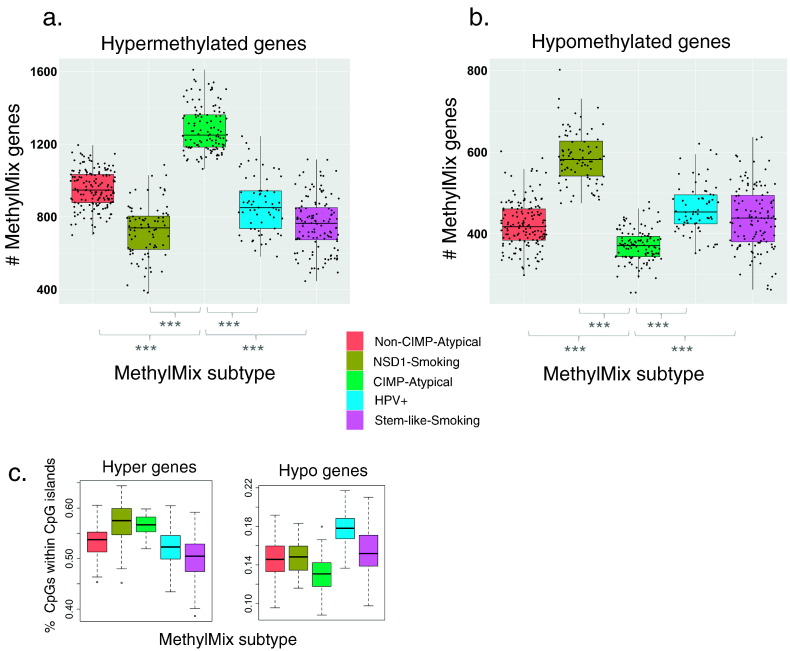
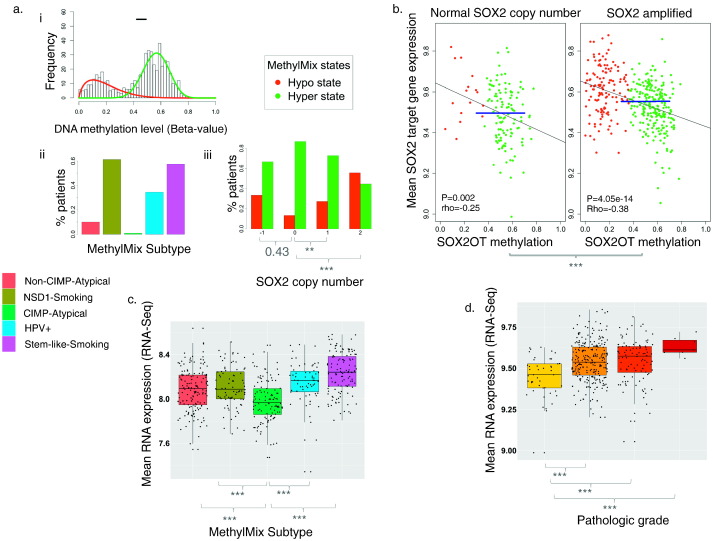
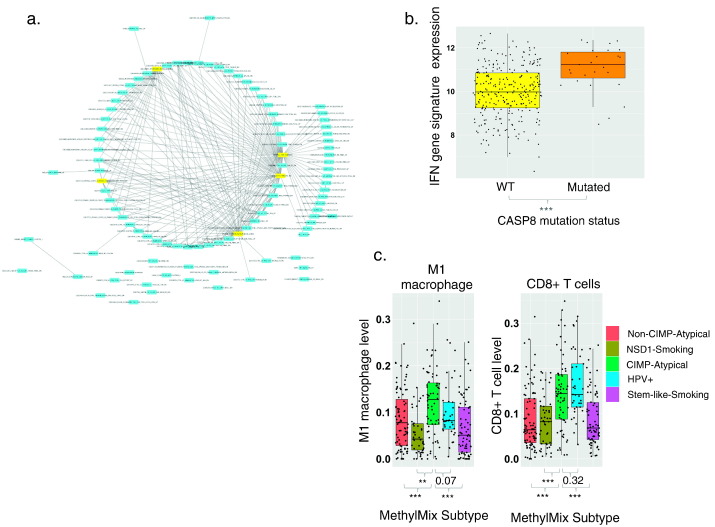
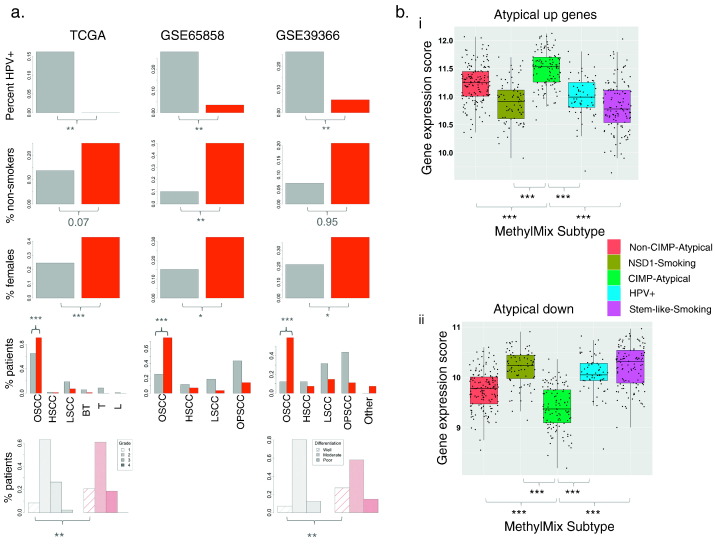
Head and neck squamous cell carcinoma (HNSCC) is broadly classified into HNSCC associated with human papilloma virus (HPV) infection, and HPV negative HNSCC, which is typically smoking-related. A subset of HPV negative HNSCCs occur in patients without smoking history, however, and these etiologically 'atypical' HNSCCs disproportionately occur in the oral cavity, and in female patients, suggesting a distinct etiology. To investigate the determinants of clinical and molecular heterogeneity, we performed unsupervised clustering to classify 528 HNSCC patients from The Cancer Genome Atlas (TCGA) into putative intrinsic subtypes based on their profiles of epigenetically (DNA methylation) deregulated genes. HNSCCs clustered into five subtypes, including one HPV positive subtype, two smoking-related subtypes, and two atypical subtypes. One atypical subtype was particularly genomically stable, but featured widespread gene silencing associated with the 'CpG island methylator phenotype' (CIMP). Further distinguishing features of this 'CIMP-Atypical' subtype include an antiviral gene expression profile associated with pro-inflammatory M1 macrophages and CD8+ T cell infiltration, CASP8 mutations, and a well-differentiated state corresponding to normal SOX2 copy number and SOX2OT hypermethylation. We developed a gene expression classifier for the CIMP-Atypical subtype that could classify atypical disease features in two independent patient cohorts, demonstrating the reproducibility of this subtype. Taken together, these findings provide unprecedented evidence that atypical HNSCC is molecularly distinct, and postulates the CIMP-Atypical subtype as a distinct clinical entity that may be caused by chronic inflammation.

Keywords: CpG island methylator phenotype; Head and neck squamous cell carcinoma; Multi-omics data analysis; antiviral gene signature; etiological subtypes.


Figures

Fig. 1
Fig. 1
Heatmap indicating differential methylation and distribution of key etiological and molecular factors between MethylMix subtypes. MethylMix subtypes identified by consensus clustering of abnormally methylated genes, identified using MethylMix (Gevaert, 2015). ‘Smokers’ refers to current or reformed former smokers (< 15 years). OSCC: oral squamous cell carcinoma.
Fig. 2
Fig. 2
Differential distribution of smoking measures between MethylMix subtypes. Distribution of a) smoking status categories (Pearson's chi-squared test), b) smoking mutation signature rates (overall number of G > T and C > A transversions per individual) (Wilcoxon rank sum test, p-values are shown for C > A and G > T mutations signatures separately), c) copy number aberration rate (Wilcoxon rank sum test) and d) mean expression of xenobiotic metabolism genes (Wilcoxon rank sum test), between MethylMix subtypes. p-Values indicate significance of the differences in smoking variables between the CIMP-Atypical subtype (green) and each other subtype separately. *p < 0.05, **p < 0.01, ***p < 0.001.
Fig. 3
Fig. 3
Different aberrant DNA methylation profiles associated with MethylMix subtypes. Variation in the mean number of a) hypermethylated and b) hypomethylated MethylMix genes per patient, between MethylMix subtypes, with a significantly higher number of hypermethylated genes, and lower number of hypomethylated genes in the CIMP-Atypical subtype (green) compared with each other subtype (Wilcoxon rank sum test). c) The proportion of CpG sites in hypermethylated genes that were within CpG islands was highest within the NSD1-Smoking (olive) and CIMP-Atypical (green) subtypes, while the number of hypomethylated CpG sites within CpG islands was highest within the HPV + subtype (blue). ***p < 0.001.
Fig. 4
Fig. 4
SOX2OT hypomethylation and SOX2 amplifications drive SOX2 pathway expression, and are lacking in the CIMP-Atypical subtype. a) i) Mixture model plot indicating two abnormal SOX2OT DNA methylation states. Histogram illustrates the frequency of patients at levels of SOX2OT methylation in tumor. DNA methylation states (mixture model components) include a hypomethylated and hypermethylated state in tumor, indicated by red and green curves, respectively. The 95% confidence interval for the range of SOX2OT methylation in normal adjacent tissue is indicated by the black horizontal bar. ii) The SOX2OT hypomethylated state occurred in only one patient within the CIMP-Atypical subtype, but occurred in 10–61% of patients in other subtypes. iii) The SOX2OT hypomethylated state (red) was more frequent among patients with either monoallelic (Siegel et al., 2016) or biallelic (Belcher et al., 2014) SOX2 amplifications, but did not differ between patients with SOX2 deletions and normal SOX2 copy number (Pearson's chi-squared test). b) Mean expression of SOX2 target genes (Blue horizontal line) was higher in patients with SOX2 amplifications compared with patients without SOX2 amplifications (Wilcoxon rank sum test), and was negatively correlated with SOX2OT methylation in both groups, indicating that both mechanisms contribute independently to SOX2-related transcription in HNSCC. Linear regression lines and p values, as well as Spearman correlation coefficients (rho) are indicated. SOX2OT MethylMix methylation states are indicated by point colors. c) Mean expression of SOX2 target genes, i.e., genes with promoters bound by SOX2 in embryonic stem cells (ESCs) (Lee et al., 2006) was lower in the CIMP-Atypical subtype compared with each other subtypes (Wilcoxon rank sum test). d) Mean expression of SOX2 target genes displays a stepwise increase with increasing pathologic grade (Wilcoxon rank sum test). **p < 0.01, ***p < 0.001.
Fig. 5
Fig. 5
The CIMP-Atypical subtype features an inflammatory gene expression signature. a) Network map illustrating enrichment for immune response genes among genes overexpressed in the CIMP-Atypical subtype. Nodes represent enriched gene sets and edges represent mutual overlap between gene sets, indicating redundancy between enriched gene sets. Hub gene sets, i.e., the top five gene sets with the highest number of edges are highlighted yellow. The top 100 gene sets identified by gene set enrichment analysis were included in the Network Map. b) Higher mean expression of a reported IFN response gene expression signature (Moserle et al., 2008) in HNSCCs with CASP8 mutations, versus those without CASP8 mutations (Wilcoxon rank sum test). c) Levels of infiltrating M1 macrophages and CD8+ T cells, inferred using CIBERSORT (Newman et al., 2015) within MethylMix subtypes Wilcoxon rank sum test p values for difference in mean TAL levels between the CIMP-Atypical subtype and other subtypes are indicated. **p < 0.01, ***p < 0.001.
Fig. 6
Fig. 6
Validation of the CIMP-Atypical subtype gene expression signature. a) Differences in the distribution of clinical features that define the CIMP-Atypical subtype between patients within (red) or not within (grey) the CIMP-Atypical subtype in the TCGA cohort (shown for reference), and in within patients predicted as belonging to the CIMP-Atypical subtype (red) or not (grey), by a gene expression classifier, in two additional patient cohorts (GSE65858 (Wichmann et al., 2015), GSE39366 (Walter et al., 2013)). There was a higher percentage of non-smokers* (never smokers or long-term reformed former smokers), female patients, OSCCs and well-differentiated/pathologic grade 1 tumors, among patients predicted as belonging to the CIMP-Atypical subtype. Pearson's chi-squared p values are indicated. b) Mean expression of genes reported as i) upregulated and ii) downregulated, in atypical HNSCC compared with typical HNSCC (smoking and alcohol-associated) (Farshadpour et al., 2012), was significantly higher and lower, respectively, within the CIMP-Atypical subtype (green) compared with within each other subtype (Wilcoxon rank sum test). *Difference in the proportion of non-smokers was restricted to HPV − HNSCCs only, as HPV + HNSCC are frequently non-smokers. Abbreviations for anatomic subsites: Oral squamous cell carcinoma (OSCC), hypopharyngeal squamous cell carcinoma (HSCC), laryngeal squamous cell carcinoma (LSCC), oropharyngeal squamous cell carcinoma (OPSCC), base of tongue (BT), tonsil (T) lip (L). *p < 0.05, **p < 0.01, ***p < 0.001.

Comment in

References

    1. Altorok N., Tsou P.-S., Coit P., Khanna D., Sawalha A.H. Genome-wide DNA methylation analysis in dermal fibroblasts from patients with diffuse and limited systemic sclerosis reveals common and subset-specific DNA methylation aberrancies. Ann. Rheum. Dis. 2014:1–9. - PMC - PubMed
    1. Anayannis N.V.J., Schlecht N.F., Belbin T.J. Epigenetic mechanisms of human papillomavirus–associated head and neck cancer. Arch. Pathol. Lab. Med. 2015 - PubMed
    1. Ang K.K. Human papillomavirus and survival of patients with oropharyngeal cancer. N. Engl. J. Med. 2010;363:24–35. - PMC - PubMed
    1. Assou S. A meta-analysis of human embryonic stem cells transcriptome integrated into a web-based expression atlas. Stem Cells. 2007;25:961–973. - PMC - PubMed
    1. Balermpas P., Rödel F., Weiss C., Rödel C., Fokas E. Tumor-infiltrating lymphocytes favor the response to chemoradiotherapy of head and neck cancer. Oncoimmunology. 2014;3:e27403. - PMC - PubMed