. 2017 Apr 19;37(16):4243-4254.
doi: 10.1523/JNEUROSCI.1961-16.2017. Epub 2017 Mar 17.

Topography and Lateralized Effect of Acute Aromatase Inhibition on Auditory Processing in a Seasonal Songbird

Affiliations

Topography and Lateralized Effect of Acute Aromatase Inhibition on Auditory Processing in a Seasonal Songbird

Geert De Groof et al. J Neurosci. .

Abstract

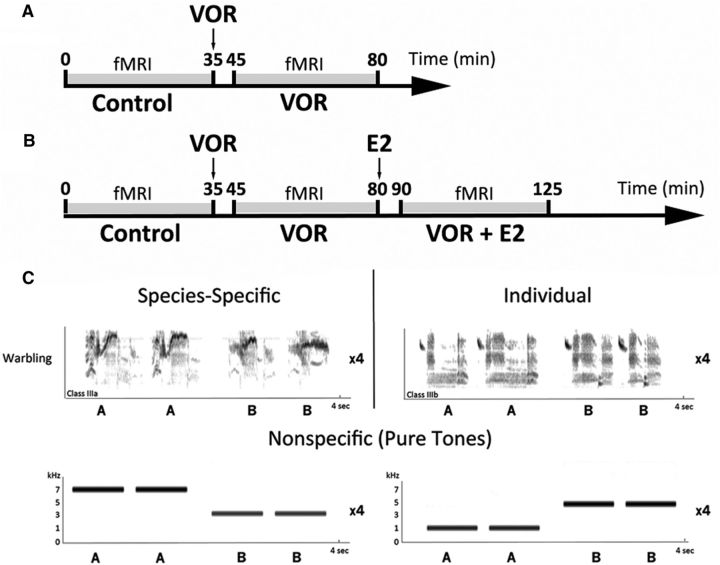
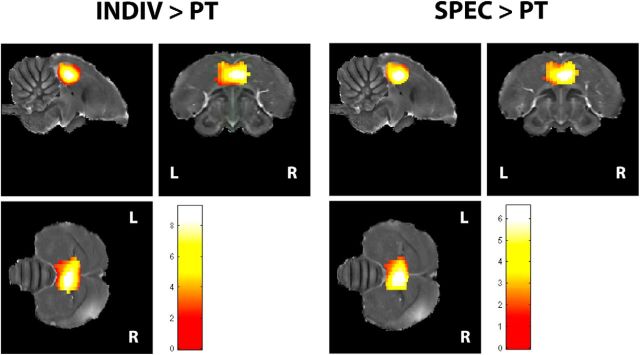
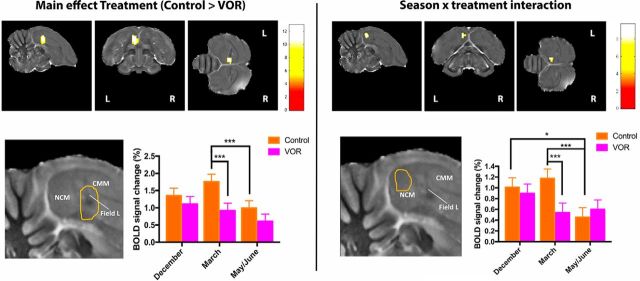
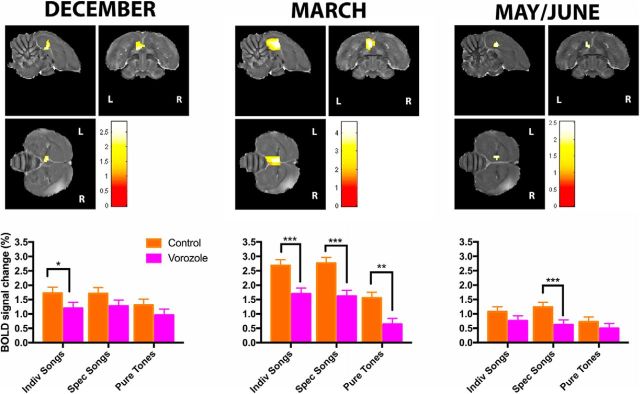
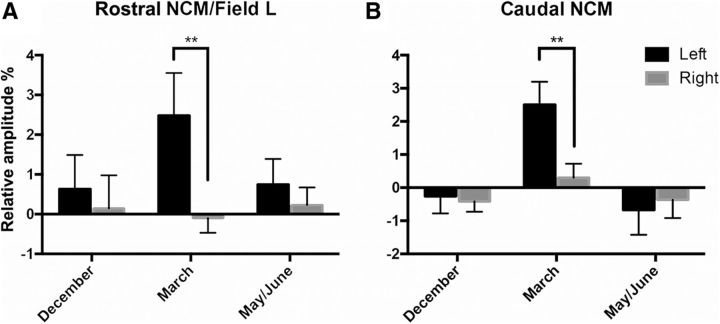
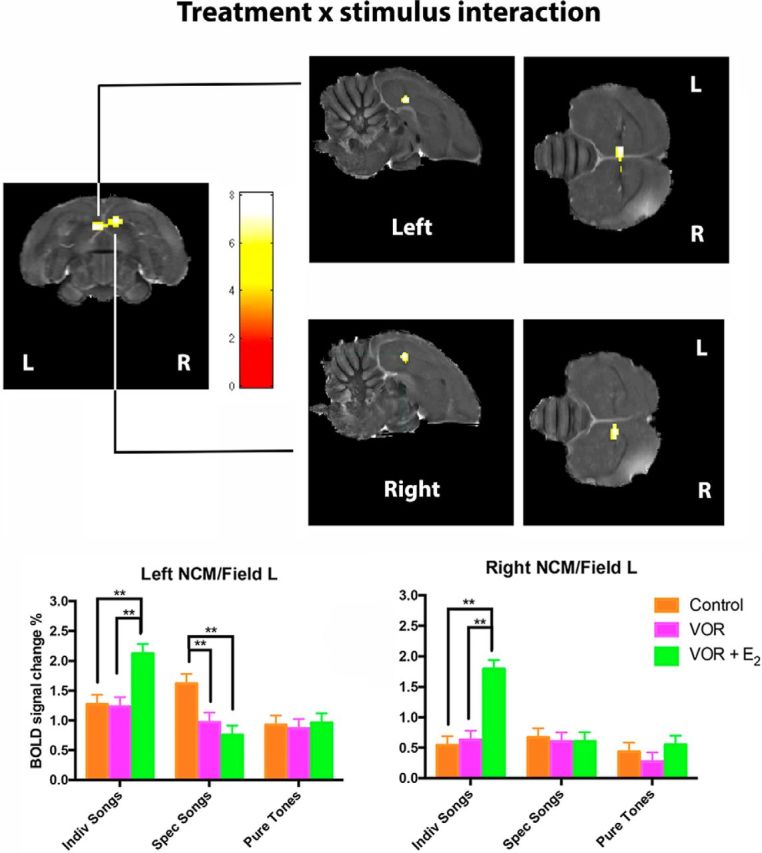
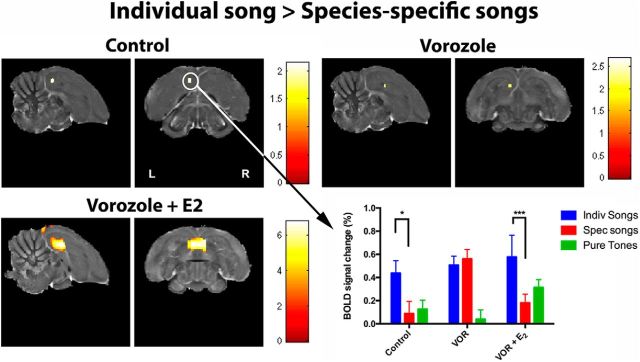
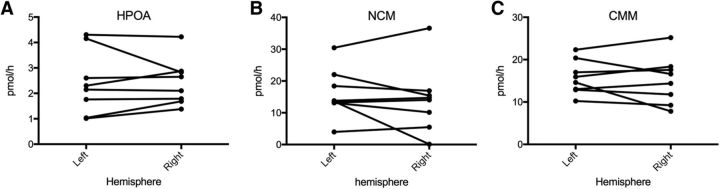
It is increasingly recognized that brain-derived estrogens (neuroestrogens) can regulate brain physiology and behavior much faster than what was previously known from the transcriptional action of estrogens on nuclear receptors. One of the best examples of such neuromodulation by neuroestrogens concerns the acute regulation of sensory coding by the auditory cortex as demonstrated by electrophysiological studies of selected neurons in zebra finches. Yet, the spatial extent of such modulation by neuroestrogens is not known. Using functional magnetic resonance imaging, we demonstrate here that acute estrogen depletion alters within minutes auditory processing in male European starlings. These effects are confined to very specific but large areas of the auditory cortex. They are also specifically lateralized to the left hemisphere. Interestingly, the modulation of auditory responses by estrogens was much larger (both in amplitude and in topography) in March than in December or May/June. This effect was presumably independent from changes in circulating testosterone concentrations since levels of the steroid were controlled by subcutaneous implants, thus suggesting actions related to other aspects of the seasonal cycle or photoperiodic manipulations. Finally, we also show that estrogen production specifically modulates selectivity for behaviorally relevant vocalizations in a specific part of the caudomedial nidopallium. These findings confirm and extend previous conclusions that had been obtained by electrophysiological techniques. This approach provides a new very powerful tool to investigate auditory responsiveness in songbirds and its fast modulation by sex steroids.SIGNIFICANCE STATEMENT Neuroestrogens can acutely modulate sensory processing in a manner similar to neuromodulators. We report that acute estrogen depletion rapidly disrupts auditory processing in large areas of the male starling brain. Effects were larger in March than in December or May/June, lateralized to the left hemisphere and specific to behaviorally relevant stimuli. These findings confirm and extend previous data that identified an acute regulation of auditory neurons in zebra finches by (1) delineating the extent of the brain region affected, (2) confirming its lateralization, and (3) demonstrating that a large part of the auditory brain regions are acutely affected by estrogens. These findings provide a very powerful tool to investigate auditory responsiveness in songbirds and its fast modulation by sex steroids.

Keywords: European starling; NCM; fMRI; lateralization; rapid estrogen action.


Figures

Figure 1.
Figure 1.
A, Experimental design used in December and March to test the effect of acute aromatase blockade (VOR; 30 mg/kg). Arrow indicates when VOR was injected. Each fMRI session lasted for 35 min and VOR injection was done 10 min before fMRI. B, Experimental design used in May/June to test the effect of acute aromatase blockade (VOR; 30 mg/kg) and acute E2 (0.5 mg/kg) when aromatase is acutely inhibited (VOR + E2). Arrows indicate when VOR or E2 were injected. Each fMRI session lasted for 35 min and injections were done 10 min before. C, Sonograms of the stimuli used. Stimuli bearing species-specific and group information consisted of two species-specific warbling motifs; stimuli bearing individual information consisted of two individual warbling motifs. Nonspecific stimuli consisted of pure tones (1, 3, 5, and 7 kHz). The depicted sequence of songs or sounds (AABB) was repeated four times per stimulus, bringing the total length of each stimulus to 16 s.
Figure 2.
Figure 2.
Regions showing a main effect of stimulus. INDIV > PT: regions showing enhanced responses during individual songs versus pure tones; SPEC > PT: regions showing enhanced responses during species-specific songs versus pure tones. The threshold was set at p < 0.05.
Figure 3.
Figure 3.
Left, Statistical map of regions displaying a significant main effect of treatment (control > VOR). Only left rostral NCM/Field L (enlarged in the high magnification adjacent to the bar graphs) is showing reduced responses in VOR versus control conditions (t test). t Values are color-coded according to the scale displayed. The threshold was set at puncorrected < 0.01. Bar graphs: plots of relative response amplitude (+SEM) of the local peak voxel in the left rostral NCM/Field L cluster. Zero level corresponds to mean activation during rest periods. Right, Statistical map of regions displaying a significant season × treatment interaction (F test). F values are color-coded according to the scale displayed. The threshold was set at puncorrected < 0.01. Only the left caudal NCM (enlarged in the high magnification adjacent to the bar graphs) shows a differential response in control versus VOR between seasons. Bar graph: average of the relative response amplitude (+SEM) of neural activations elicited by all stimuli (INDIV, SPEC, and PT) per session in the cluster illustrated at the top (values from the voxel with the maximum F value). Zero level corresponds to mean activation during rest periods. ***pFWE < 0.05; *puncorrected < 0.01.
Figure 4.
Figure 4.
Statistical map of regions displaying a significant main effect of treatment for each season separately. Left rostral NCM/Field L is showing reduced responses in VOR versus control conditions (t test) in all seasons, but in March also the caudal part of NCM shows reduced responses with VOR. t Values are color-coded according to the scale displayed. The threshold was set at puncorrected < 0.05. Bar graphs: plots of relative response amplitude (+SEM) of the local peak voxel per season. Zero level corresponds to mean activation during rest periods. Stars indicate significant differences between control and VOR conditions (***pFWE < 0.05; **puncorrected < 0.001; puncorrected < 0.01).
Figure 5.
Figure 5.
Lateralization of VOR effects. Relative amplitudes (percentage) of differential (control − VOR) responses to all auditory stimuli (INDIV, SPEC, and PT) pooled in left (black bars) and right (gray bars) rostral (A) and caudal (B) NCM. Positive values indicate that the region of interest was more activated during control than during VOR treatment and vice versa. The error bars correspond to SEMs across subjects. Stars indicate that the difference between left and right NCM clusters is significant by post hoc tests (**p < 0.01).
Figure 6.
Figure 6.
Statistical map of regions displaying a significant treatment × stimulus interaction (F test). F values are color-coded according to the scale displayed. The threshold was set at puncorrected < 0.001. Bar graphs: plots of relative response amplitude (+SEM) of the local peak voxel in the left and right rostral NCM/Field L cluster. Zero level corresponds to mean activation during rest periods. Stars indicate significant differences between treatments (**p < 0.001).
Figure 7.
Figure 7.
Statistical maps of regions displaying a significant difference in response to INDIV versus SPEC songs (t test) during different treatments. t Values are color-coded according to the scale displayed on the right. Note the large individual song selectivity over both left and right NCM when E2 is administered. Bar graphs: relative response amplitude (+SEM) of neural activations elicited by the different song stimuli in left caudal NCM (values from the voxel with the maximum t value in control). Zero level corresponds to mean activation during rest periods. Stars indicate significant differences between INDIV and SPEC-specific songs (*p < 0.05, ***p < 0.001).
Figure 8.
Figure 8.
Aromatase activity does not differ between hemispheres in the (A) HPOA, (B) NCM, and (C) CMM.

Comment in

Similar articles

Cited by

References

    1. Alward BA, de Bournonville C, Chan TT, Balthazart J, Cornil CA, Ball GF (2016) Aromatase inhibition rapidly affects in a reversible manner distinct features of birdsong. Sci Rep 6:32344. 10.1038/srep32344 - DOI - PMC - PubMed
    1. Apfelbeck B, Mortega K, Kiefer S, Kipper S, Vellema M, Villavicencio CP, Gahr M, Goymann W (2013) Associated and disassociated patterns in hormones, song, behavior and brain receptor expression between life-cycle stages in male black redstarts, Phoenicurus ochruros. Gen Comp Endocrinol 184:93–102. 10.1016/j.ygcen.2012.11.027 - DOI - PubMed
    1. Appeltants D, Del Negro C, Balthazart J (2002) Noradrenergic control of auditory information processing in female canaries. Behav Brain Res 133:221–235. 10.1016/S0166-4328(02)00005-0 - DOI - PubMed
    1. Avey MT, Phillmore LS, MacDougall-Shackleton SA (2005) Immediate early gene expression following exposure to acoustic and visual components of courtship in zebra finches. Behav Brain Res 165:247–253. 10.1016/j.bbr.2005.07.002 - DOI - PubMed
    1. Ball GF, Wingfield JC (1987) Changes in plasma levels of sex steroids in relation to multiple broodedness and nest site density in male starlings. PhysiolZool 60:191–196.

Publication types

LinkOut - more resources