. 2017 Apr 4;114(14):E2911-E2919.
doi: 10.1073/pnas.1702564114. Epub 2017 Mar 17.

Common nonmutational NOTCH1 activation in chronic lymphocytic leukemia

Affiliations

Common nonmutational NOTCH1 activation in chronic lymphocytic leukemia

Giulia Fabbri et al. Proc Natl Acad Sci U S A. .

Abstract

Activating mutations of NOTCH1 (a well-known oncogene in T-cell acute lymphoblastic leukemia) are present in ∼4-13% of chronic lymphocytic leukemia (CLL) cases, where they are associated with disease progression and chemorefractoriness. However, the specific role of NOTCH1 in leukemogenesis remains to be established. Here, we report that the active intracellular portion of NOTCH1 (ICN1) is detectable in ∼50% of peripheral blood CLL cases lacking gene mutations. We identify a "NOTCH1 gene-expression signature" in CLL cells, and show that this signature is significantly enriched in primary CLL cases expressing ICN1, independent of NOTCH1 mutation. NOTCH1 target genes include key regulators of B-cell proliferation, survival, and signal transduction. In particular, we show that NOTCH1 transactivates MYC via binding to B-cell-specific regulatory elements, thus implicating this oncogene in CLL development. These results significantly extend the role of NOTCH1 in CLL pathogenesis, and have direct implications for specific therapeutic targeting.

Keywords: NOTCH1; chronic lymphocytic leukemia; transcriptional network.


Conflict of interest statement

The authors declare no conflict of interest.

Figures
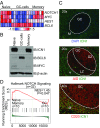
Fig. 1.
Fig. 1.
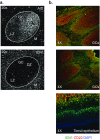
NOTCH1 is expressed and activated in naïve and memory B cells, putative normal counterparts of CLL. (A) Gene-expression profile analysis (HG-U133 Plus 2.0 Array) of NOTCH1, MYC, HES1, and BCL6 in normal mature naive, GC, and memory B-cell subpopulations isolated from human tonsils (23). Each column corresponds to an independent sample. The mRNA expression pattern of NOTCH1 in naïve and memory B cells is similar to that of MYC, typically expressed only in a small fraction of GC–B cells (69), and opposite to that of BCL6, a known GC master regulator (81). Moreover, NOTCH1 expression levels are concordant with those of HES1, a NOTCH1 target in multiple tissue types (11). (B) Immunoblot (IB) analysis of ICN1, BCL6, MYC, and control β-actin in mature B-cell subpopulations isolated from human tonsils. (C) Immunofluorescence (IF) staining of ICN1, the dark-zone GC-marker AID (82), and the B-cell–specific surface antigen CD20 in a human tonsil section. (D) Tracking of the HALLMARK_NOTCH_SIGNALING geneset from the Molecular Signatures Database v5.1 (software.broadinstitute.org/gsea/msigdb/index.jsp) in normal mature B-cell subpopulations by GSEA. Abbreviations: DZ, dark zone; LZ, light zone; M, mantle zone.
Fig. S1.
Fig. S1.
ICN1 is expressed in the B-cell fraction populating the mantle zone (M) of the germinal centers (GCs). (A) Double IF staining of ICN1 and AID in a representative GC in a human tonsil section. (B) Double IF staining of ICN1 and the B-cell–specific surface antigen CD20 at lower magnification (4×) in a human tonsil section.
Fig. 2.
Fig. 2.
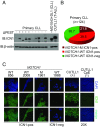
Primary CLL cases express ICN1 because of NOTCH1 PEST-truncations or alternative mechanisms. (A) IB analysis of ICN1 and control β-actin in 10 representative PB CLL cases, 4 carrying NOTCH1 PEST-truncations (ΔPEST) and 6 NOTCH1–wild-type (WT), in the control T-ALL cell line CUTLL1 (83) and in MO1043 CLL cells cocultured with OP9 stromal cells expressing the NOTCH1 ligand DL1 (54). The full set of analyzed primary CLL cases, including those reported here, is displayed in Fig. S2. (B) Frequency of ICN1 positivity in 124 primary CLL cases. (C) IF staining of ICN1 in primary ICN1+ (pos) and ICN1 (neg) CLL cells and in the control CUTLL1 T-ALL cell line in basal conditions (+) and upon Compound E (CpE, 24 h, 1 μM) treatment (−).
Fig. S2.
Fig. S2.
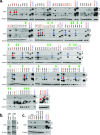
ICN1 expression analysis in a panel of primary CLL cases and PBMC. (A) IB analysis of ICN1 and control β-actin in a panel of 124 CLL PB primary CLL cases, (B) in primary NOTCH1–wild-type CLL cells treated with the γ-secretase inhibitor Compound E (CpE, 500 nM, 8 h) or control DMSO, and (C) in PBMC protein extracts and representative primary CLL cases expressing ICN1. Samples are color-coded based on the NOTCH1 mutational status [red, clonal NOTCH1 PEST-truncating events; orange, subclonal NOTCH1 PEST-truncating events; blue, RAG-mediated NOTCH1 translocation (83); and black, NOTCH1–wild-type]. Samples in gray were excluded from the analysis because of low quality of the protein lysate, low viability, or low leukemic representation. Color-coded arrows indicate cases subjected to RNA-Seq analysis: dark red denotes NOTCH1-mutated cases expressing ICN1; blue, NOTCH1–wild-type cases expressing ICN1; and green, ICN1 NOTCH1–wild-type cases. Abbreviations: MO+DL1, MO1043 cells cocultured on OP9-DL1 cells (54); s.e., short exposure; l.e., long exposure.
Fig. S3.
Fig. S3.
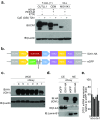
Establishment of ICN1-HA inducible MO1043 CLL cell line. (A) IB analysis of ICN1 and control β-actin in T-ALL cell lines (CUTLL1 and CEM) and MO1043 CLL cells treated with the γ-secretase inhibitor Compound E (CpE, 500 nM, 72 h) or control DMSO. (B) Diagrams of the pINDUCER vectors used to express ICN1-HA or control eGFP upon doxycycline addition (30). (C) IB analysis of HA (ICN1) and β-actin in MO1043-ICN1-HA whole cellular lysates (WCE) obtained upon doxycycline addition (1 μg/mL for 24 h, six independent inductions, a–f). (D) HA (ICN1) IB analysis of cytoplasmic (CE) and nuclear (NE) fractions of MO1043-ICN1-HA and control eGFP cells upon doxycycline addition (1 μg/mL for 24 h). β-Tubulin (β-tub) and Lamin-B1 IBs serve as controls for the purity of the subcellular fractions. (E) qRT-PCR analysis of DTX1 mRNA in MO1043-ICN1-HA cells upon doxycycline addition (1 μg/mL for 24 h, six independent inductions, a–f). Results are presented relative to those of induced MO1043-eGFP cells, set as 1. The bar graphs show the mean values, and the error bars represent the SD.
Fig. 3.
Fig. 3.
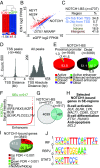
Identification of NOTCH1 direct targets in CLL. (A) Hierarchical clustering of RNA-Seq profiles of MO1043-ICN1-HA and -eGFP cells (Pearson correlation with average linkage, minimum log2 expression 5 and minimum SD 1). (B) Scatter plot of log2-transformed RNA-Seq FPKM values of differentially expressed genes between MO1043-ICN1-HA and -eGFP control CLL cells (FDR < 0.001). (C and D) Distribution of NOTCH1 binding sites (BS) in the genome of MO1043-ICN1-HA CLL cells. (E) Functional classification of NOTCH1-BS mapping to proximal promoters and distal regions of the genome based on their overlap with the H3K4me3, H3K4me, H3K27Ac and H3K27me3 histone marks. (F) Rank order of increasing H3K27Ac fold-enrichment at enhancer loci in in MO1043-ICN1-HA CLL cells. (G) Overlap between NOTCH1-BS and superenhancers identified with the ROSE algorithm (35, 36). (H) Representative examples of genes regulated by NOTCH1 via binding to superenhancer regions. (I) Intersection between RNA-Seq and ChIP-Seq data obtained in MO1043-ICN1-HA CLL cells. (J) Top three significantly (P = 1.00E-15) enriched transcription factor motifs lying ±200 bp of NOTCH1-BS. Abbreviations: NoExp, transcripts not expressed in MO1043-ICN1-HA cells; NoMov, transcripts not moving upon ICN1-HA expression; SEs, superenhancers; TF, transcription factor.
Fig. S4.
Fig. S4.
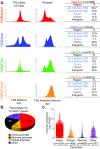
Distribution of histone modifications across the genome of MO1043-ICN1-HA cells. (A) Genomic distribution of histone marks-decorated regions with respect to the closest TSS (Left) and their distribution in the genome (Right). (B) Functional promoter status of genes based on the chromatin configuration of their TSSs and gene-expression levels (FPKM) of the corresponding transcripts (C) in MO1043-ICN1-HA CLL cells upon doxycycline addition (1 μg/μL for 24 h).
Fig. S5.
Fig. S5.
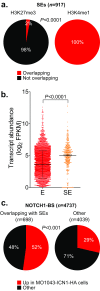
CLL superenhancers features. (A) Overlap of MO1043-ICN1-HA superenhancers with the H3K27me3 and H3K4me1 chromatin marks. (B) Expression levels (log2 FPKM) of genes associated with superenhancers (SE) or regular enhancers (E) identified in MO1043-ICN1-HA cells. (C) Differential up-regulation of genes associated with NOTCH1 binding sites (BS) overlapping with superenhancer regions or located elsewhere in the genome (“other”) of MO1043-ICN1-HA cells. In A and C, P values are reported according to a two-tailed Fisher’s exact test. In B, the P value was calculated based on an unpaired unequal variance two-tailed Student's t test.
Fig. S6.
Fig. S6.
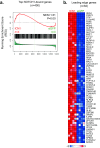
Significant enrichment of top NOTCH1-bound genes in MO1043-ICN1-HA compared with control -eGFP cells. (A) GSEA enrichment plot depicting significant enrichment of a geneset composed by the top 400 NOTCH1-bound genes (i.e., top genes ranked based on ChIP-Seq P values) in MO1043-ICN1-HA CLL cells compared with -eGFP controls and (B) corresponding leading edge genes.
Fig. 4.
Fig. 4.
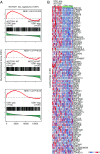
The NOTCH1 CLL signature is enriched in primary CLL cases expressing ICN1. (A) GSEA enrichment plots depicting significant enrichment of the NOTCH1 CLL signature in NOTCH1-mutated (M) and wild-type (WT) primary CLL cases expressing ICN1+ (ICN1-pos) compared with ICN1 (ICN1-neg) cases, and heatmap of RNA-Seq profiles of corresponding leading edge genes (n = 90) (B).
Fig. S7.
Fig. S7.
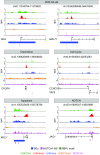
Representative examples of NOTCH1-direct target genes. Representative ChIP-Seq plots depicting NOTCH1 binding and histone marking patterns at genes that are bound by NOTCH1 and up-regulated in MO1043-ICN1-HA CLL cells. The y axes in the ChIP-Seq plots indicate fragment density in reads per million (rpm).
Fig. 5.
Fig. 5.
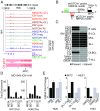
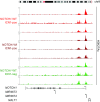
A NOTCH1-bound superenhancer region regulating MYC expression is recurrently duplicated in CLL. (A) NOTCH1 occupancy profiles and histone marks patterns in the 8q24 region encompassing the MYC locus (chr8:128000000–129000000, hg19) in primary CLL cases and MO1043-ICN1-HA cells, with corresponding peaks depicted in the box below the ChIP-Seq plots. The y axes in the ChIP-Seq plots indicate fragment density in reads per million (rpm). The two boxes below the called peaks represent segmentation data (7, 53) visualized using IGV (2.3.59), with red denoting a region of CN gain, blue a CN loss, and white depicting a normal (diploid) CN. Individual genes in the region are aligned in the Bottom panel. (B) Schematic representation of the distribution of superenhancers, NOTCH1 binding sites, and RBPJ motifs in the 8q24 region encompassing the MYC locus. (C) In the heatmap, rows correspond to normal or malignant B cells (52, 84) and two control T-ALL cell lines, and columns represent the two superenhancers identified in the 8q24 region encompassing the MYC locus, color-coded based on their presence or absence in the displayed cell type (light gray, absent; black, present). (D) ChIP-qPCR analysis of NOTCH1 and H3K27Ac at the MYC-associated superenhancer regions identified in MO1043-ICN1-HA CLL cells; results are presented relative to those obtained with IgG (IgG; control) and to a distal actin locus, set as 1. (E) qRT-PCR analysis of MYC and HES1 mRNA expression in three representative primary CLL cases, upon NOTCH1 signaling induction via coculture on stromal OP9-DL1 cells in the presence or absence of the γ-secretase inhibitor Compound E (CpE, 24 h, 1 μM, Left and Center), or upon basal NOTCH1 signaling inhibition in the presence of CpE (Right). Results are represented relative to those of CLL cells cocultured on OP9 stromal cells (Left), on OP9-DL1 stromal cells in the presence of CpE (Center), or with vehicle DMSO (Right), set as 1. The full set of analyzed primary CLL cases, including those represented here, is displayed in Fig. S9. The bar graphs in D and E show the mean values, and the error bars represent the SD between triplicates. Abbreviations: B-LCL, B-lymphoblastoid cell line; DLBCL, diffuse large B-cell lymphoma; MCL, mantle cell lymphoma; SE, superenhancer; SLL, small lymphocytic lymphoma.
Fig. S8.
Fig. S8.
Focal copy number gains recurrently affect the NOTCH1-bound 8q24 B-cell–specific superenhancer region in CLL. (A) Overlap between NOTCH1-bound 8q24 superenhancers observed in CLL and other tissues. In the heatmap, rows correspond to different tissues (normal and malignant) reported in the dbSUPER database (84) and columns represent the two superenhancers identified in the 8q24 region encompassing the MYC locus, color-coded based on their presence or absence in the displayed cell type (light gray, absent; black, present). (B) Frequency of NOTCH1 mutations and MYC CN gains (including gains encompassing only the MYC-associated superenhancer region) in a panel of 452 primary CLL cases, as reported in Puente et al. (7) and of MYC CN gains (including gains encompassing only the MYC-associated superenhancer region) in a panel of 353 primary CLL cases (53). (C) Graphic display of CN data from 30 patients harboring CN gains involving the 8q24 region encompassing the newly identified MYC-associated superenhancer regions in CLL. Segmentation data were visualized using IGV (2.3.59), where each track represents one sample, and white denotes a normal (diploid) CN, red a region of CN gain and blue a CN loss. Individual genes in the region are aligned in the Bottom panel, and the red boxed area highlights the minimal common region (MCR) of CN gain. In the bottom are highlighted the locations of NOTCH1 binding sites, RBPJK motifs (RBP_Jkappa V$RBPJK_Q4 and V$RBPJK_01 from the TRANSFAC database) and the superenhancers identified in CLL. (D) Heatmap showing the distribution of NOTCH1 mutations and MYC CN gains identified in n = 71/452 primary CLL cases, as reported in Puente et al. (7). In the heatmap, each column corresponds to a different case, and the two Bottom rows represent NOTCH1 mutations (M) and MYC alterations (act), color-coded based on their presence or absence in the displayed case (light gray, absent; black, present). The Top row shows the IGHV mutational status of the displayed cases (M, mutated; NA, not available; UM, unmutated).
Fig. S9.
Fig. S9.
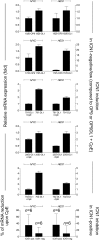
MYC RNA levels are responsive to modulation of NOTCH1 signaling activation in primary CLL cases. qRT-PCR analysis of MYC and HES1 mRNAs expression in primary CLL cases upon ICN1 induction via coculture on stromal OP9-DL1 cells in the presence or absence of the γ-secretase inhibitor Compound E (CpE, 1 μM, 24 h, top five graphs), or upon basal NOTCH1 signaling inhibition in the presence of CpE (Bottom graph). Results are represented relative to those of CLL cells cocultured on OP9 stromal cells, on OP9-DL1 stromal cells in the presence of CpE, or with vehicle DMSO, set as 1. ICN1-positive cases depicted in the Bottom panel (n = 6) include 3 NOTCH1-mutated and 3 NOTCH1–wild-type cases.
Fig. S10.
Fig. S10.
H3K27Ac ChIP-Sequencing plots at the NOTCH1 locus in nine primary CLL cases. The y axes in the ChIP-Seq plots indicate fragment density in reads per million. M, mutated; WT, wild-type.

References

    1. Fabbri G, Dalla-Favera R. The molecular pathogenesis of chronic lymphocytic leukaemia. Nat Rev Cancer. 2016;16(3):145–162. - PubMed
    1. Pekarsky Y, Zanesi N, Croce CM. Molecular basis of CLL. Semin Cancer Biol. 2010;20(6):370–376. - PMC - PubMed
    1. Fabbri G, et al. Analysis of the chronic lymphocytic leukemia coding genome: Role of NOTCH1 mutational activation. J Exp Med. 2011;208(7):1389–1401. - PMC - PubMed
    1. Puente XS, et al. Whole-genome sequencing identifies recurrent mutations in chronic lymphocytic leukaemia. Nature. 2011;475(7354):101–105. - PMC - PubMed
    1. Wang L, et al. SF3B1 and other novel cancer genes in chronic lymphocytic leukemia. N Engl J Med. 2011;365(26):2497–2506. - PMC - PubMed

Publication types