. 2017 Mar 18:6:e24542.
doi: 10.7554/eLife.24542.

Fail-safe control of translation initiation by dissociation of eIF2α phosphorylated ternary complexes

Affiliations

Fail-safe control of translation initiation by dissociation of eIF2α phosphorylated ternary complexes

Martin D Jennings et al. Elife. .

Abstract

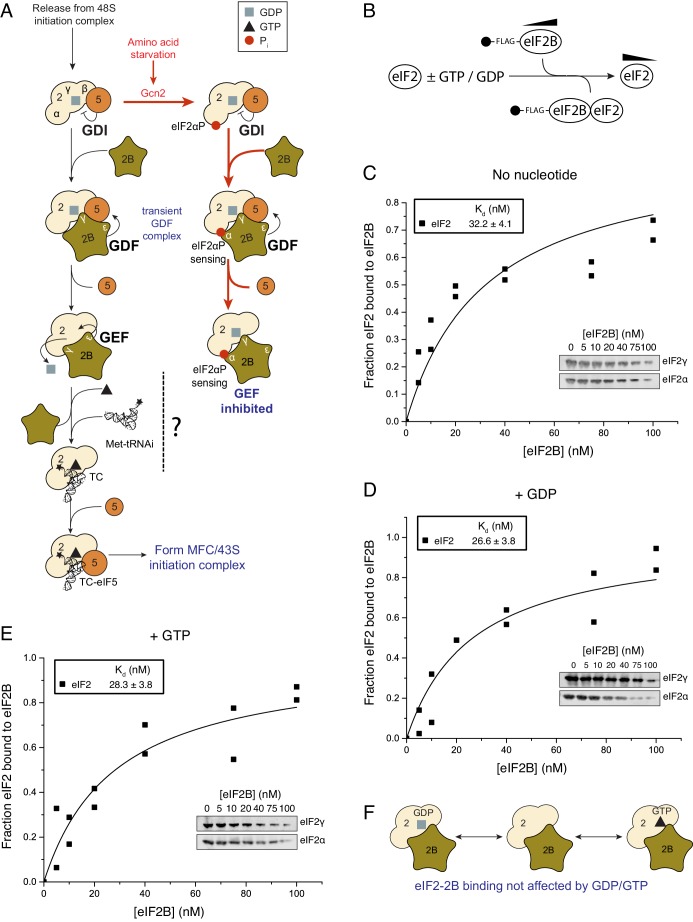
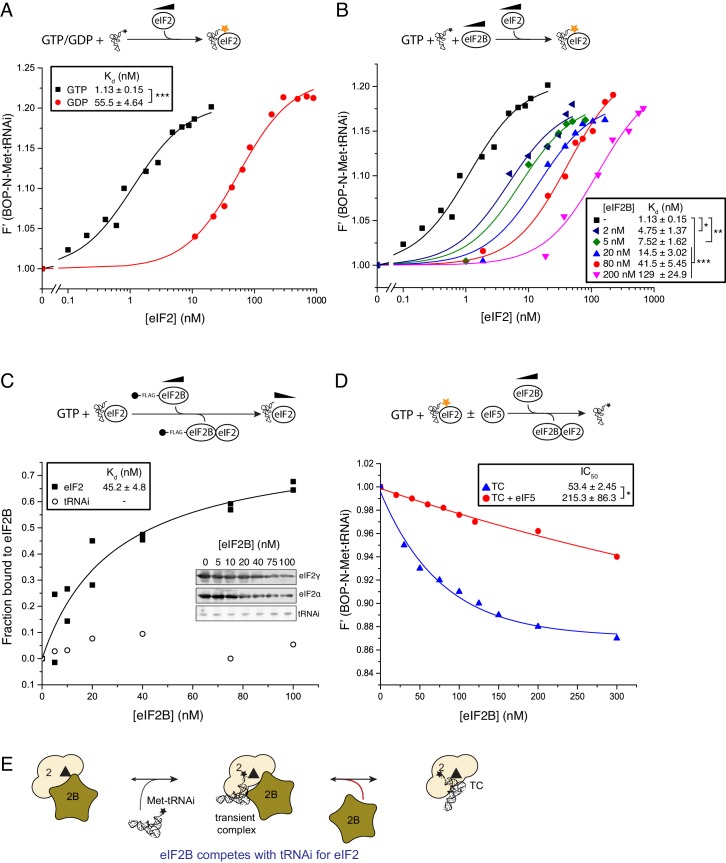
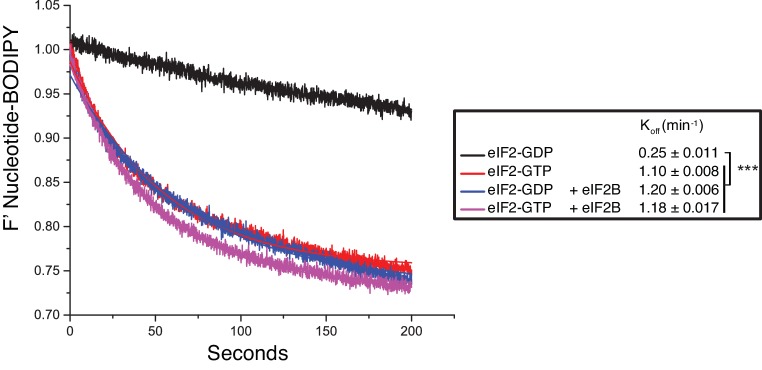
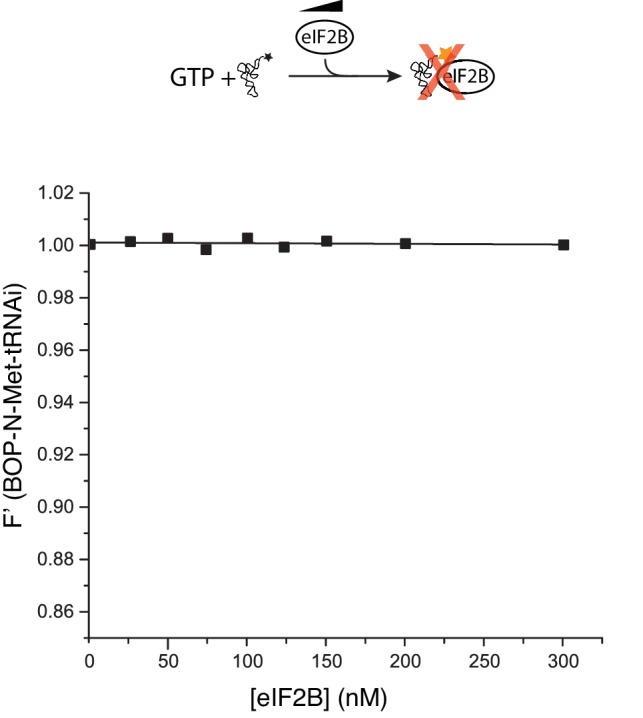
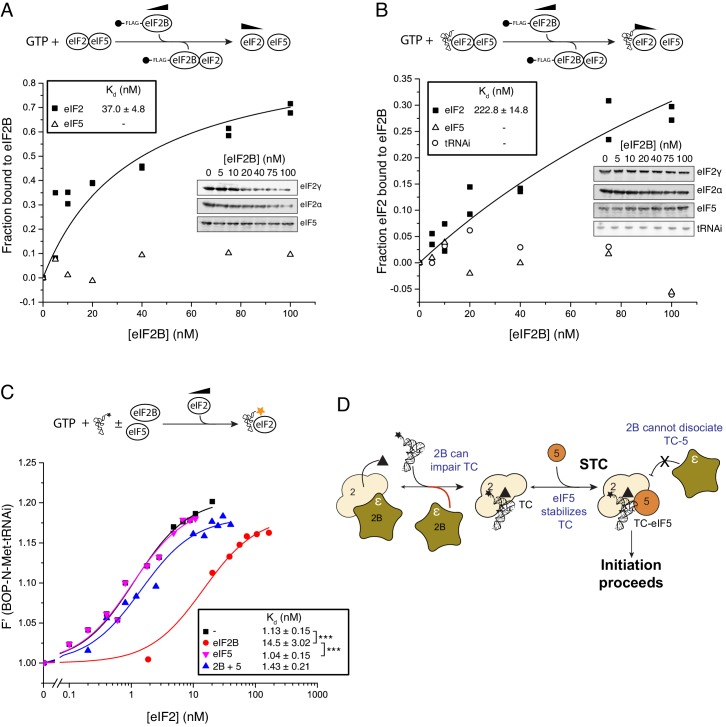
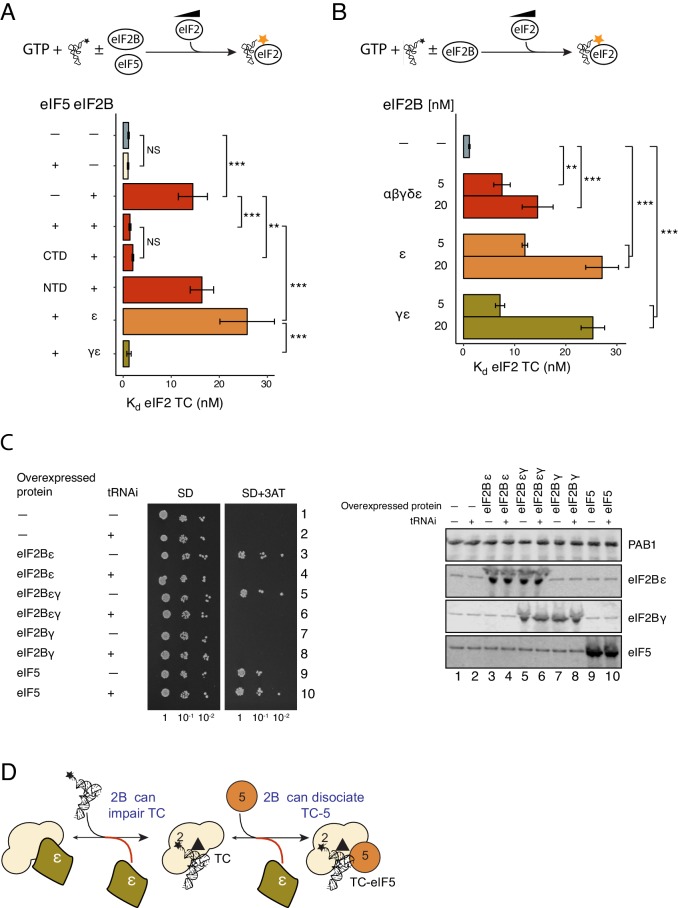
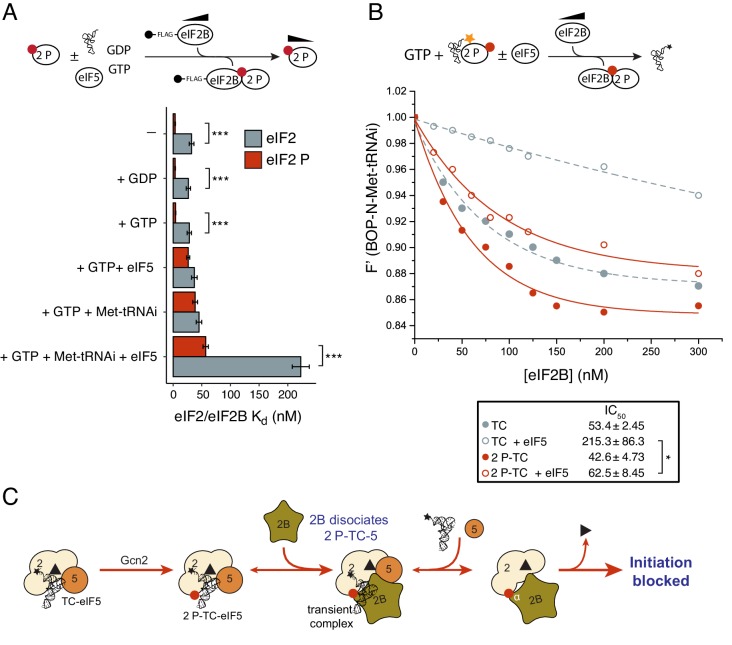
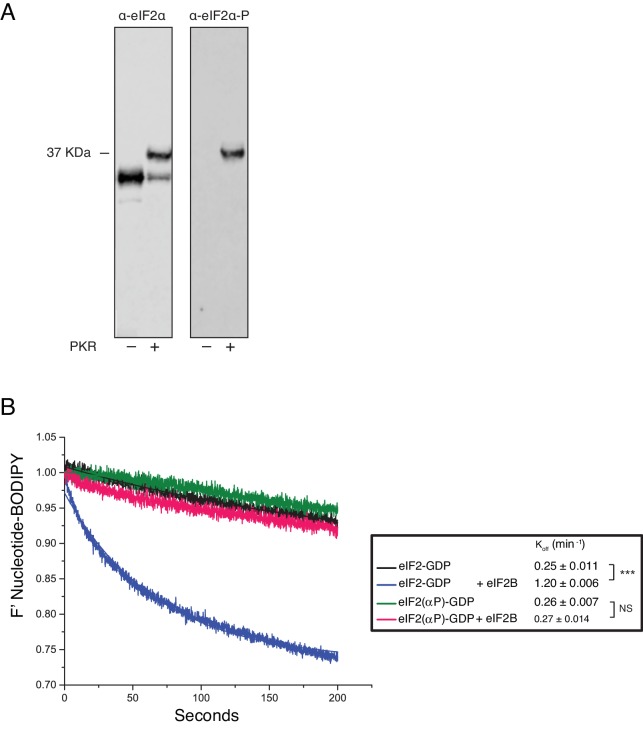
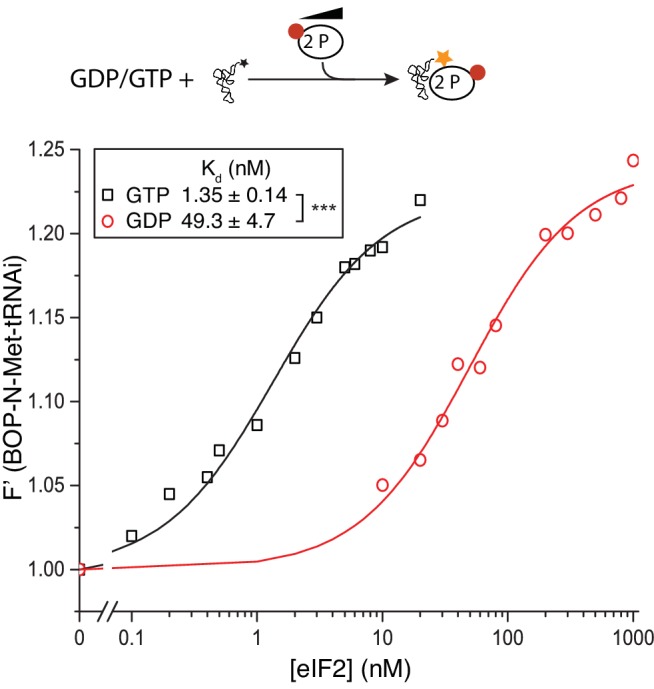
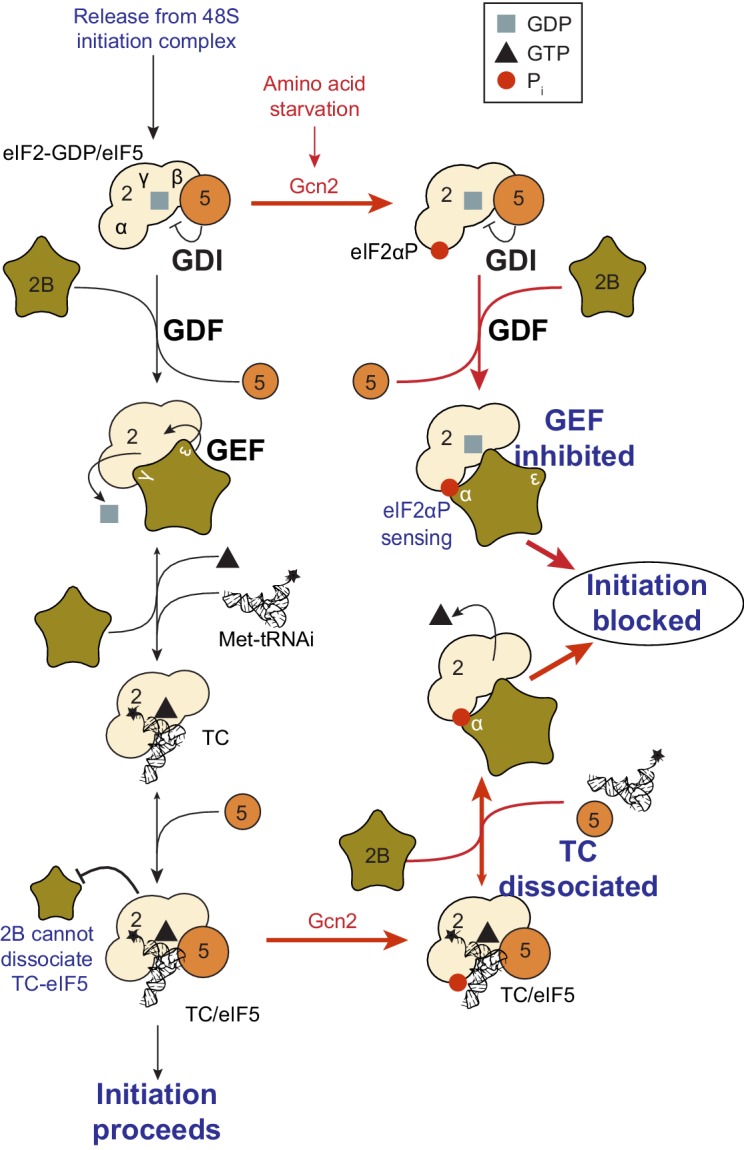
Phosphorylation of eIF2α controls translation initiation by restricting the levels of active eIF2-GTP/Met-tRNAi ternary complexes (TC). This modulates the expression of all eukaryotic mRNAs and contributes to the cellular integrated stress response. Key to controlling the activity of eIF2 are translation factors eIF2B and eIF5, thought to primarily function with eIF2-GDP and TC respectively. Using a steady-state kinetics approach with purified proteins we demonstrate that eIF2B binds to eIF2 with equal affinity irrespective of the presence or absence of competing guanine nucleotides. We show that eIF2B can compete with Met-tRNAi for eIF2-GTP and can destabilize TC. When TC is formed with unphosphorylated eIF2, eIF5 can out-compete eIF2B to stabilize TC/eIF5 complexes. However when TC/eIF5 is formed with phosphorylated eIF2, eIF2B outcompetes eIF5 and destabilizes TC. These data uncover competition between eIF2B and eIF5 for TC and identify that phosphorylated eIF2-GTP translation initiation intermediate complexes can be inhibited by eIF2B.

Keywords: ISR; S. cerevisiae; biochemistry; chromosomes; eIF2; eIF2B; genes; protein interactions; translational control.


Conflict of interest statement

The authors declare that no competing interests exist.

Figures

Figure 1.
Figure 1.. eIF2 affinity for eIF2B is unaffected by guanine nucleotides.
(A) Current model for eIF2 activation and inhibition by phosphorylated eIF2. Interactions and activities are explained in the introduction. (B). Overview of eIF2/eIF2B equilibrium binding assay. (C–E). Affinity determined by mixing 2 nM eIF2 with increasing concentrations of eIF2B immobilised on anti-Flag resin. Flag resin was pelleted and the eIF2 remaining in each supernatant fraction was resolved by SDS-PAGE and immunoblotted with two eIF2 subunit antibodies (inset, eIF2α and eIF2γ). Fraction bound at equilibrium was determined by quantification: total (lane 0 nM eIF2B) minus fraction remaining in the supernatant (graphs) and used calculate the dissociation constants (nM ± standard error (SE)) indicated. Assays were done either without nucleotide (C) or in the presence of either 1 mM GDP (D) or 1 mM GTP (E). (F). Cartoon of figure conclusion. DOI: http://dx.doi.org/10.7554/eLife.24542.003
Figure 2.
Figure 2.. eIF2B competes with Met-tRNAi for binding to eIF2-GTP.
(A) Binding curves titrating 20 nM BOP-N-Met-tRNAi with eIF2 in the presence of 1 mM GTP or GDP. Dissociation constants (nM) ± SE are indicated (inset). ***p<0.001 two-tailed T-test. (B). As in A only in the presence of 1 mM GTP ± increasing concentrations of eIF2B (0–200 nM). *p<0.05, **p<0.01, ***p<0.001 two-tailed T-test C). Supernatant depletion affinity capture as done in Figure 1 with 1 mM GTP +2 nM Met-tRNAi with calculated affinity constants ± SE D). Dissociation curves for 20 nM BOP-N-Met-tRNAi pre-bound to eIF2 (20 nM) and saturating GTP (1 mM) upon titration of eIF2B (0–300 nM) (blue triangles). eIF5 (20 nM) was added to some reactions (red circles). Calculated IC50 values ± SE for dissociation of TC are shown in inset box (nM). *p<0.05 two-tailed T-test. (E). Model for eIF2B competition with tRNA. DOI: http://dx.doi.org/10.7554/eLife.24542.004
Figure 2—figure supplement 1.
Figure 2—figure supplement 1.. Guanine nucleotide release from eIF2.
Fluorescent-BODIPY labelled GDP or GTP release from eIF2 (20 nM) in the presence of 1 mM ‘dark’ nucleotide ± eIF2B (5 nM). Calculated Koff ± SE is shown in the box. ***p<0.001, two-tailed T-test. DOI: http://dx.doi.org/10.7554/eLife.24542.005
Figure 2—figure supplement 2.
Figure 2—figure supplement 2.. eIF2B does not bind Met-tRNAi.
Fluorescence binding assay in the absence of eIF2, showing eIF2B does not bind to or alter fluorescence of BOP-N-Met-tRNAi. DOI: http://dx.doi.org/10.7554/eLife.24542.006
Figure 3.
Figure 3.. eIF5 stabilizes Met-tRNAi binding to TC.
(A) eIF2/eIF2B equilibrium binding assay in the presence of eIF5 as described in legend to Figure 1. eIF2 (2 nM) was pre-bound (prior to mixing with eIF2B) with eIF5 (20 nM) and GTP (1 mM) then mixed with increasing concentrations of eIF2B immobilised on anti-Flag resin. (B). As in A, but with Met-tRNAi (20 nM) also added prior to eIF2B. (C). Binding curves titrating BOP-N-Met-tRNAi (20 nM) with eIF2 in the presence of GTP (1 mM) as in Figure 2A, but with eIF5 (20 nM), eIF2B (20 nM) or both eIF5 and eIF2B (20 nM each). Dissociation constants (nM) are indicated. ***p<0.001, two-tailed T-test. (D). Model for eIF5 stabilization of TC. DOI: http://dx.doi.org/10.7554/eLife.24542.007
Figure 4.
Figure 4.. eIF2Bε antagonises eIF5 STC function.
(A) Kd measurements from eIF2-TC formation assays shown in Figure 4—source data 1. Experiments were performed as in Figure 2A.±20 nM eIF2B ±20 nM eIF5, eIF5-NTD or eIF5-CTD. (B). As panel A except ±5 nM or 20 nM of full eIF2B complex, eIF2Bγε subcomplexes or eIF2B epsilon alone. (C). Left, Serial dilution growth assay of gcn2∆ yeast cells bearing multi-copy plasmids overexpressing the indicated combination of tRNAi (IMT4) and eIF2Bε (GCD6), eIF2Bγ (GCD1), eIF5 (TIF5) or eIF2Bεγ (GCD6 + GCD1) grown on minimal and 3AT medium. Right, Western blot of strains used confirming overexpression of indicated proteins. (D). Model showing eIF2Bε antagonism of TC/eIF5 and TC. **p<0.01, ***p<0.001, NS non-significant (p≥0.05), two-tailed T-test. DOI: http://dx.doi.org/10.7554/eLife.24542.008
Figure 5.
Figure 5.. eIF2B antagonizes eIF2(αP)-TC/eIF5 complexes.
(A) Kd measurements ± SE from eIF2(αP)/eIF2B complex formation assays shown in Figure 5—source data 1 and compared with measurements made with non-phosphorylated eIF2 shown in previous figures. (B). Dissociation curves for 20 nM BOP-N-Met-tRNAi pre-bound to eIF2(αP) (20 nM) and saturating GTP (1 mM) upon titration of eIF2B (0–300 nM) (red circles). eIF5 (20 nM) was added to some reactions (open circles). Data shown in Figure 2D is reproduced for comparison in gray symbols. Calculated IC50 values ± SE are shown in the box. (C). Model for eIF2B inhibition of eIF2(αP)-TC/eIF5 complexes. *p<0.05, ***p<0.001, two-tailed T-test. DOI: http://dx.doi.org/10.7554/eLife.24542.010
Figure 5—figure supplement 1.
Figure 5—figure supplement 1.. Phosphorylation of eIF2α and its impact on eIF2B activity.
(A) Phos-Tag gel western blots of eIF2 ± PKR with total eIF2α (left) and ser-51 phospho-specific (right) antibodies. (B). Fluorescent-BODIPY labelled GDP release from eIF2 or eIF2(αP) (20 nM) in the presence of 1 mM ‘dark’ nucleotide ±5 nM eIF2B. Calculated Koff ± SE shown. ***p<0.001, NS non-significant (p≥0.05), two-tailed T-test. DOI: http://dx.doi.org/10.7554/eLife.24542.012
Figure 5—figure supplement 2.
Figure 5—figure supplement 2.. eIF2(αP) affinity for Met-tRNAi.
Top, Cartoon descripting assay. Bottom: Fluorescence of 20 nM BOP-N-Met-tRNAi binding to 2 nM eIF2(αP) in the presence of 1 mM GDP or GTP. Calculated Kds ± SE shown in inset box. ***p<0.001, two-tailed T-test. DOI: http://dx.doi.org/10.7554/eLife.24542.013
Figure 6.
Figure 6.. Model summary of new activities of eIF2 and eIF5.
A summary model of interactions between eIF2, eIF2B, eIF5 and Met-tRNAi to generate eIF2-TC/eIF5 complexes and their inhibition by eIF2(αP). See text for details. DOI: http://dx.doi.org/10.7554/eLife.24542.014

Comment in

References

    1. Algire MA, Maag D, Lorsch JR. Pi release from eIF2, not GTP hydrolysis, is the step controlled by start-site selection during eukaryotic translation initiation. Molecular Cell. 2005;20:251–262. doi: 10.1016/j.molcel.2005.09.008. - DOI - PubMed
    1. Alone PV, Dever TE. Direct binding of translation initiation factor eIF2gamma-G domain to its GTPase-activating and GDP-GTP exchange factors eIF5 and eIF2B epsilon. Journal of Biological Chemistry. 2006;281:12636–12644. doi: 10.1074/jbc.M511700200. - DOI - PubMed
    1. Amberg DC, Burke DJ, Strathern JN. Methods in Yeast Genetics. Cold Spring Harbor, New York: Cold Spring Harbor Laboratory Press; 2005.
    1. Asano K, Clayton J, Shalev A, Hinnebusch AG. A multifactor complex of eukaryotic initiation factors, eIF1, eIF2, eIF3, eIF5, and initiator tRNA(Met) is an important translation initiation intermediate in vivo. Genes & Development. 2000;14:2534–2546. doi: 10.1101/gad.831800. - DOI - PMC - PubMed
    1. Asano K, Krishnamoorthy T, Phan L, Pavitt GD, Hinnebusch AG. Conserved bipartite motifs in yeast eIF5 and eIF2Bepsilon, GTPase-activating and GDP-GTP exchange factors in translation initiation, mediate binding to their common substrate eIF2. The EMBO Journal. 1999;18:1673–1688. doi: 10.1093/emboj/18.6.1673. - DOI - PMC - PubMed

MeSH terms