Tp-e interval and Tp-e/QTc ratio as novel surrogate markers for prediction of ventricular arrhythmic events in hypertrophic cardiomyopathy
- PMID: 28315570
- PMCID: PMC5512198
- DOI: 10.14744/AnatolJCardiol.2017.7581
Tp-e interval and Tp-e/QTc ratio as novel surrogate markers for prediction of ventricular arrhythmic events in hypertrophic cardiomyopathy
Abstract
Objective: Hypertrophic cardiomyopathy (HCM) as a common genetic heart disease characterized by ventricular hypertrophy and myocardial fibrosis is significantly associated with a higher risk of fatal ventricular arrhythmic events (VAEs). We aimed to assess the interval between the peak and the end of the electrocardiographic T wave (Tp-e) and Tp-e/corrected QT (QTc) ratio as candidate markers of ventricular arrhythmias in patients with HCM.
Methods: In this single-center, prospective study, a total of 66 patients with HCM and 88 controls were enrolled. The patients were divided into two groups: those with VAEs (n=26) and those without VAEs (n=40). Tp-e interval and Tp-e/QTc ratio were measured using a 12-lead electrocardiogram.
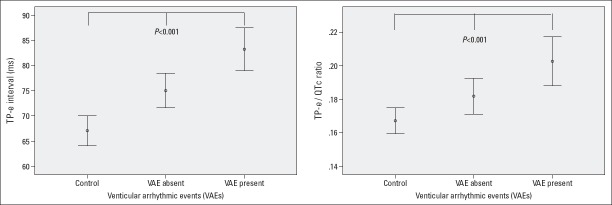
Results: Tp-e interval was significantly longer and Tp-e/QTc ratio were significantly higher in HCM patients than in the controls. In correlation analysis, maximal left ventricular (LV) thickness also has a significant positive correlation with Tp-e interval (r=0.422, p<0.001) and Tp-e/QTc ratio (r=0.348, p<0.001). Finally, multivariable regression analysis showed that a history of syncope, Tp-e interval [OR (odds ratio): 1.060; 95% confidence interval (CI): 1.005-1.117); p=0.012], Tp-e/QTc ratio (OR: 1.148; 95% CI: 1.086-1.204); p=0.049], and maximal LV thickness were independent predictors of VAEs in patients with HCM.
Conclusion: Our findings suggested that prolonged Tp-e interval and increased Tp-e/QTc ratio may be good surrogate markers for the prediction of VAEs in HCM.
Conflict of interest statement
Figures

Comment in
-
Tp-e interval and Tp-e/QTc ratio: new choices for risk stratification of arrhythmic events in patients with hypertrophic cardiomyopathy.Anatol J Cardiol. 2017 Jun;17(6):493. doi: 10.14744/AnatolJCardiol.2017.7865. Anatol J Cardiol. 2017. PMID: 28617297 Free PMC article. No abstract available.
-
Simple electrocardiographic parameters predicting risk of hypertrophic cardiomyopathy: Too simple?Anatol J Cardiol. 2017 Nov;18(5):373. doi: 10.14744/AnatolJCardiol.2017.8021. Anatol J Cardiol. 2017. PMID: 29145219 Free PMC article. No abstract available.
References
-
- Maron BJ. Hypertrophic cardiomyopathy:an important global disease. Am J Med. 2004;116:63–5. - PubMed
-
- Maron BJ, Gardin JM, Flack JM, Gidding SS, Kurosaki TT, Bild DE. Prevalence of hypertrophic cardiomyopathy in a general population of young adults:Echocardiographic analysis of 4111 subjects in the CARDIA Study. Coronary Artery Risk Development in (Young) Adults. Circulation. 1995;92:785–9. - PubMed
-
- Elliott PM, Anastasakis A, Borger MA, Borggrefe M, Cecchi F, Charron P, et al. 2014 ESC Guidelines on diagnosis and management of hypertrophic cardiomyopathy:the Task Force for the Diagnosis and Management of Hypertrophic Cardiomyopathy of the European Society of Cardiology (ESC) Eur Heart J. 2014;35:2733–79. - PubMed
-
- Todiere G, Aquaro GD, Piaggi P, Formisano F, Barison A, Masci PG, et al. Progression of myocardial fibrosis assessed with cardiac magnetic resonance in hypertrophic cardiomyopathy. J Am Coll Cardiol. 2012;60:922–9. - PubMed
Publication types
MeSH terms
Substances
LinkOut - more resources
Full Text Sources
Other Literature Sources
Medical