. 2017 Jul 1;525(10):2358-2375.
doi: 10.1002/cne.24209. Epub 2017 Apr 21.

5-HT3A -driven green fluorescent protein delineates gustatory fibers innervating sour-responsive taste cells: A labeled line for sour taste?

Affiliations

5-HT3A -driven green fluorescent protein delineates gustatory fibers innervating sour-responsive taste cells: A labeled line for sour taste?

J M Stratford et al. J Comp Neurol. .

Abstract

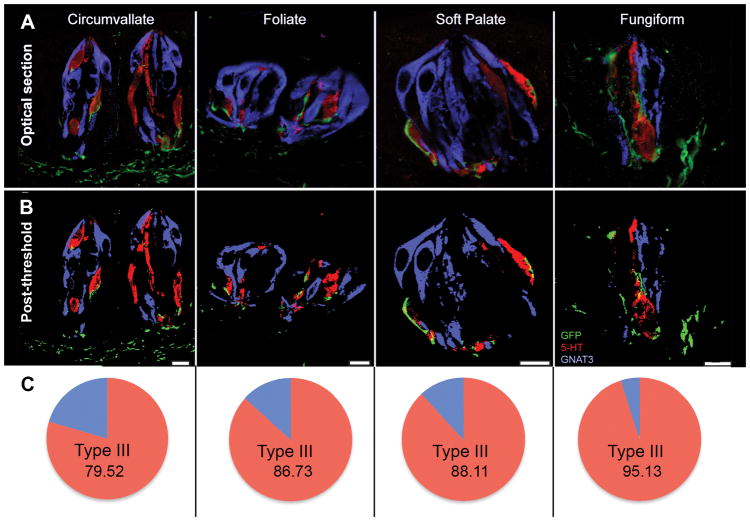
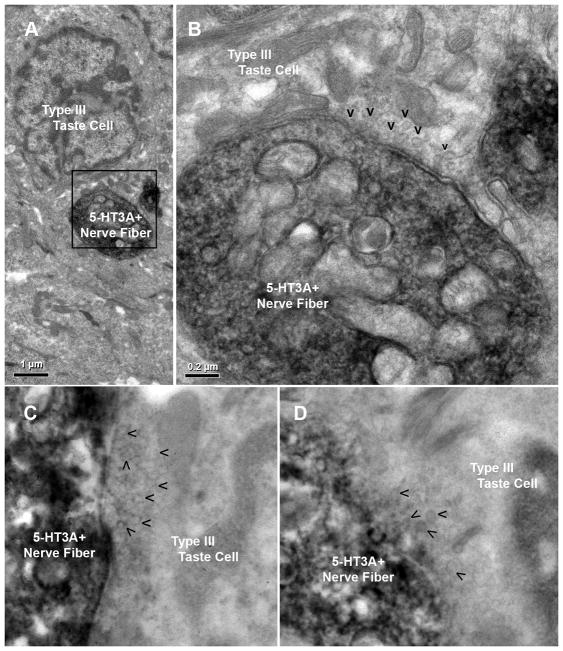
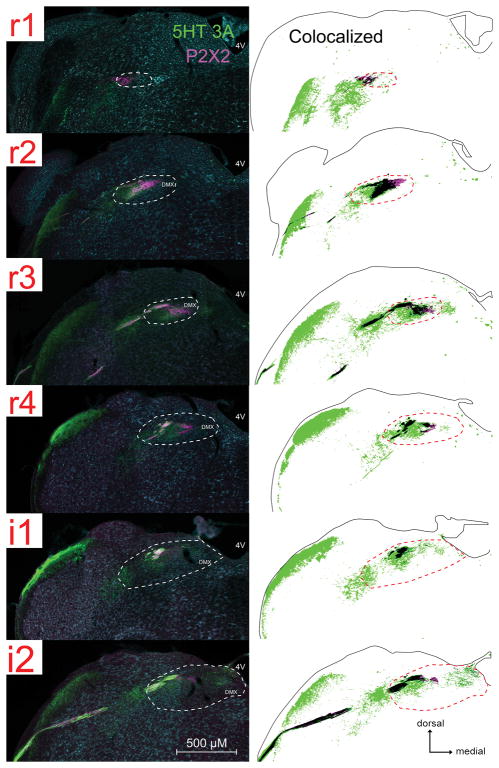
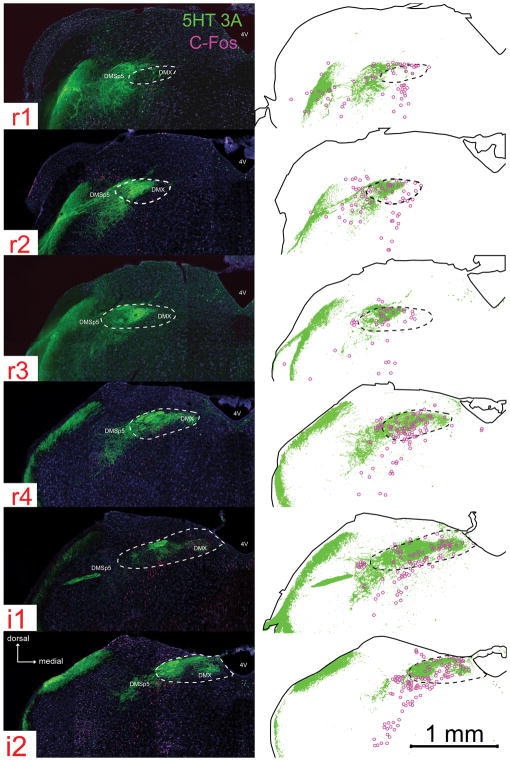
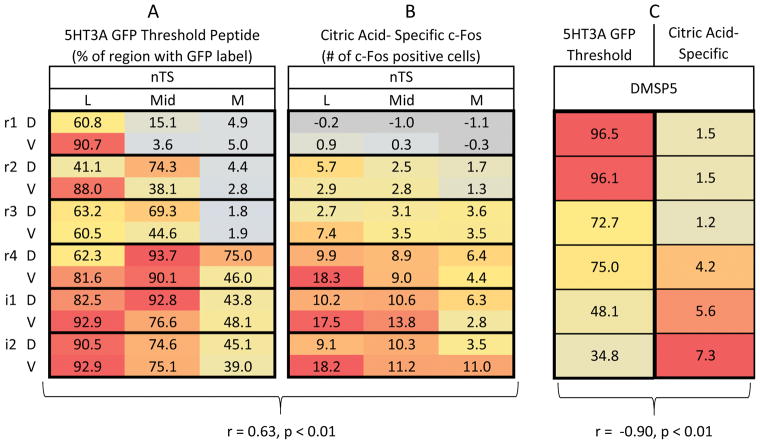
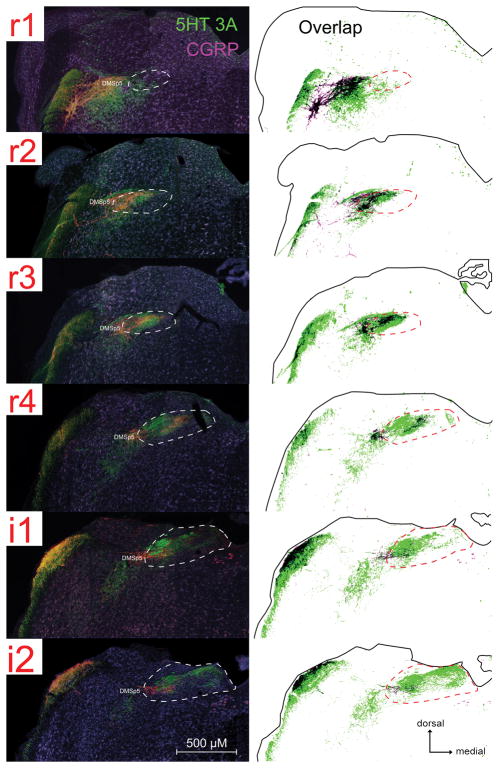
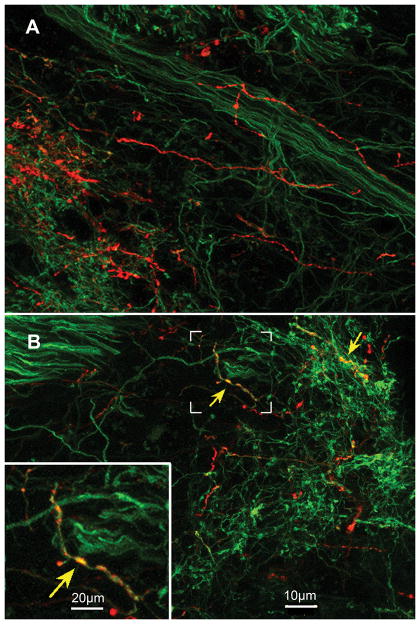
Taste buds contain multiple cell types with each type expressing receptors and transduction components for a subset of taste qualities. The sour sensing cells, Type III cells, release serotonin (5-HT) in response to the presence of sour (acidic) tastants and this released 5-HT activates 5-HT3 receptors on the gustatory nerves. We show here, using 5-HT3A GFP mice, that 5-HT3 -expressing nerve fibers preferentially contact and receive synaptic contact from Type III taste cells. Further, these 5-HT3 -expressing nerve fibers terminate in a restricted central-lateral portion of the nucleus of the solitary tract (nTS)-the same area that shows increased c-Fos expression upon presentation of a sour tastant (30 mM citric acid). This acid stimulation also evokes c-Fos in the laterally adjacent mediodorsal spinal trigeminal nucleus (DMSp5), but this trigeminal activation is not associated with the presence of 5-HT3 -expressing nerve fibers as it is in the nTS. Rather, the neuronal activation in the trigeminal complex likely is attributable to direct depolarization of acid-sensitive trigeminal nerve fibers, for example, polymodal nociceptors, rather than through taste buds. Taken together, these findings suggest that transmission of sour taste information involves communication between Type III taste cells and 5-HT3 -expressing afferent nerve fibers that project to a restricted portion of the nTS consistent with a crude mapping of taste quality information in the primary gustatory nucleus.

Keywords: chemesthesis; citric acid; serotonin receptor; solitary tract; taste bud; trigeminal.


Figures

Fig. 1
Fig. 1. 5-HT3A-positive nerve fibers innervate Type III, but not Type II, taste cells in all taste fields
A: Single optical sections of taste buds with 5-HT3A GFP (green), 5-HT (red; Type III cell marker) and GNAT3 (blue; Type II cell marker) immunoreactivity. B: The same image from A after threshold and binarization.
Fig. 2
Fig. 2. 5-HT3A-positive nerve fibers colocalize with Type III taste cells to a greater extent than with Type II taste cells in all taste fields
The percentage of 5-HT3A GFP positive fibers that colocalize with Type II cells (5-HT; yellow) is significantly greater than the percentage of 5-HT3A GFP positive fibers that colocalize with Type III cells (GNAT3; teal). Data represent the average percent of dual-labeled pixels in every optical section of multiple z-stacks ± SEM. CV: circumvallate; FF: fungiform; Fol: foliate; SP: soft palate. * = yellow bar significantly greater than teal bar.
Fig. 3
Fig. 3. 5-HT3A GFP-positive nerve fibers synapse onto Type III cells
Left: Immuno-electron microscopy of 5-HT3A GFP mouse CV taste buds with 5-HT3A GFP-positive nerve fibers clearly identified as dark, labeled nerve fibers (DAB reaction for GFP immunolabel). Right: An enlarged field of view from left that highlights a synapse between a 5-HT3A GFP-positive nerve fiber and a Type III cell, as evident by small clear vesicles (V’s) in close association with the plasma membrane of the Type III cell. Identification of the presynaptic cell as Type III is based primarily on nuclear morphology which shows substantial heterochromatin and several indentations. No synapses are seen with Type II cells (not shown).
Fig. 4
Fig. 4. Neuronal activation in response to citric acid intraoral taste stimulation is found in areas of the nTS and adjacent DMSp5 that are densely innervated by 5-HT3A-positive fibers
For each image-drawing pair: Left: photomicrographs of 5-HT3A GFP (green) and c-Fos (magenta) immunoreactivity. The white dotted line demarcates the boundary of the nTS. 4V: 4th ventricle; DMSP5: dorsomedial nucleus of the descending trigeminal complex; DMX: dorsal motor nucleus of the vagus. Right: Spatial distribution of 5-HT3A labeled pixels that are 2X standard deviation of background (identified using a customized MATLAB program). The magenta circles are chartings of citric acid- evoked c-Fos activation in the brainstem. The solid black outline indicates the boundaries of the tissue; whereas the black dotted line demarcates the boundary of the nTS.
Fig. 5
Fig. 5. Citric acid evoked Fos-LI is positively correlated with 5-HT3AGFP fiber distribution in the nTS, but negatively correlated within the DMSp5
A and B: Spatial pattern ‘heat maps’ of: the number of 5-HT3A GFP labeled pixels (A) or citric acid- specific (raw count – avg. water) Fos-LI (B) with the nTS. Each 3×2 box within each column represents one level of the nTS subdivided into subfields: lateral (L), Mid, medial (M) in dorsal (D) & ventral (V) tiers. Each heat map is color coded so that blue = minimal; red = maximal. In B, for clarity, negative numbers (i.e. where citric acid counts were less than water counts) are shown in grey. Citric acid-specific Fos-LI is positively correlated with 5-HT3A GFP labeled pixels within the nTS (r = 0.65, p < 0.01). C: Apatial pixel density of 5-HT3A GFP pixels (left) vs. citric acid- specific Fos-LI (right). Each box represents quantifications within the DMSp5 at one level of the nTS and each heat map is color coded so that blue = minimal; red = maximal. The number of 5-HT3A GFP labeled pixels within the nTS is negatively (inversely) correlated with citric acid-specific Fos-LI (r = -090, p < 0.01). All numbers represent the average value for each anatomical area (nTS subregions or DMSp5).
Fig. 6
Fig. 6. 5-HT3A-positive fibers are found in some brainstem regions where CGRP immunoreactivity is also found within the nTS and adjacent DMSp5
For each image-drawing pair: Left: photomicrographs of 5-HT3A GFP (green) and CGRP (magenta) immunoreactivity. The white dotted line demarcates the boundary of the nTS. DMSP5: dorsomedial nucleus of the descending trigeminal complex. Right: Spatial distribution of CGRP and 5-HT3A labeled pixels that are 2X standard deviation of background (identified using a customized MATLAB program). Labeled pixels that overlap are shown as black. The solid black outline indicates the boundaries of the tissue; whereas the black dotted line demarcates the boundary of the nTS.
Fig. 7
Fig. 7. 5-HT3A GFP and CGRP mostly do not colocalize within the lateral nTS or DMSp5 or anterior taste fields
LSCM images of (A) the rostral nTS (R4), and (B) the DMSp5, and (C) palatal taste bud showing little colocalization of CGRP (red) and 5-HT3A-driven GFP (green). No fibers show co-localization in the image of the rostral nTS (A) whereas a few fibers (yellow arrow) show co-localization in the DMSp5. Inset at lower left of panel B shows a higher magnification of the bracketed region in the main figure showing a double-labeled varicose axon.

Similar articles

Cited by

References

    1. Accolla R, Carleton A. Internal body state influences topographical plasticity of sensory representations in the rat gustatory cortex. Proceedings of the National Academy of Sciences of the United States of America. 2008;105:4010–4015. - PMC - PubMed
    1. Accolla R, Bathellier B, Petersen CC, Carleton A. Differential spatial representation of taste modalities in the rat gustatory cortex. The Journal of neuroscience : the official journal of the Society for Neuroscience. 2007;27:1396–1404. - PMC - PubMed
    1. Archer S, Li TT, Evans AT, Britland ST, Morgan H. Cell reactions to dielectrophoretic manipulation. Biochem Biophys Res Commun. 1999;257:687–698. - PubMed
    1. Bae YC, Oh JM, Hwang SJ, Shigenaga Y, Valtschanoff JG. Expression of vanilloid receptor TRPV1 in the rat trigeminal sensory nuclei. J Comp Neurol. 2004;478:62–71. - PubMed
    1. Barretto RP, Gillis-Smith S, Chandrashekar J, Yarmolinsky DA, Schnitzer MJ, Ryba NJ, Zuker CS. The neural representation of taste quality at the periphery. Nature. 2015;517:373–376. - PMC - PubMed

MeSH terms

Substances

LinkOut - more resources