

Joint Estimation of Multiple High-dimensional Precision Matrices
- PMID: 28316451
- PMCID: PMC5351783
- DOI: 10.5705/ss.2014.256
Joint Estimation of Multiple High-dimensional Precision Matrices
Abstract
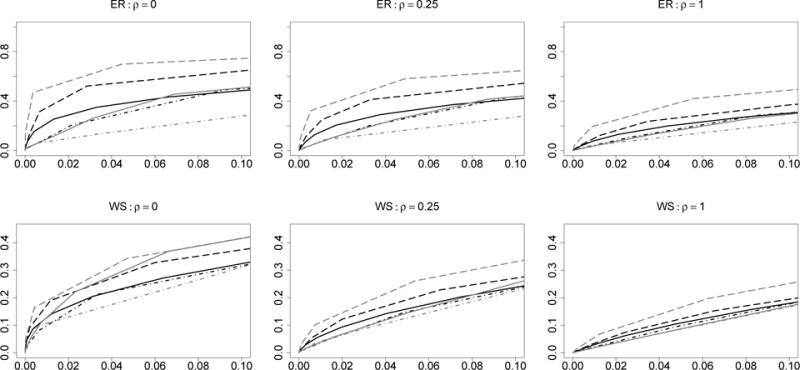
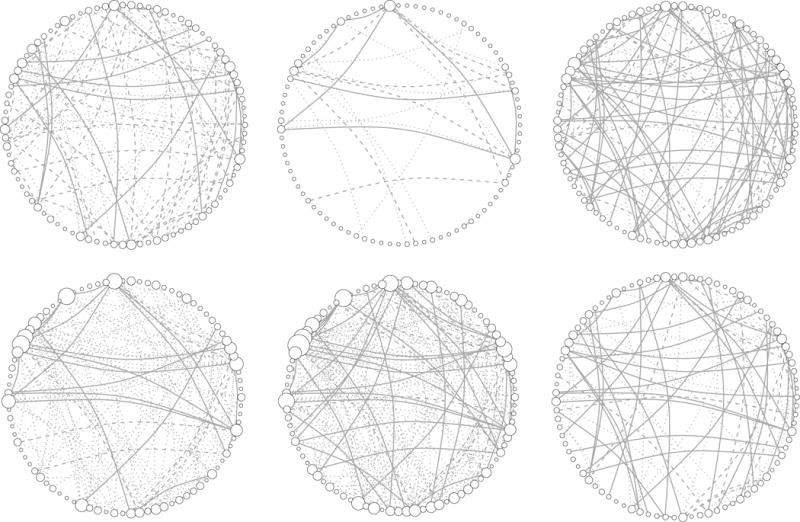
Motivated by analysis of gene expression data measured in different tissues or disease states, we consider joint estimation of multiple precision matrices to effectively utilize the partially shared graphical structures of the corresponding graphs. The procedure is based on a weighted constrained ℓ∞/ℓ1 minimization, which can be effectively implemented by a second-order cone programming. Compared to separate estimation methods, the proposed joint estimation method leads to estimators converging to the true precision matrices faster. Under certain regularity conditions, the proposed procedure leads to an exact graph structure recovery with a probability tending to 1. Simulation studies show that the proposed joint estimation methods outperform other methods in graph structure recovery. The method is illustrated through an analysis of an ovarian cancer gene expression data. The results indicate that the patients with poor prognostic subtype lack some important links among the genes in the apoptosis pathway.
Keywords: Constrained optimization; Convergence rate; Graph recovery; Precision matrices; Second-order cone programming; Sparsity.
Figures
References
-
- Anderson TW. An introduction to multivariate statistical analysis. Wiley-Interscience; 2003.
-
- Banerjee O, Ghaoui LE, d’Aspremont A. Model selection through sparse maximum likelihood estimation for multivariate gaussian or binary data. J Machine Learning Research. 2008;9:485–516.
-
- Cai T, Liu W, Luo X. A constrained ℓ1 minimization approach to sparse precision matrix estimation. Journal of American Statistical Association. 2011;106:594–607.
-
- Candés E, Tao T. The dantzig selector: Statistical estimation when p is much larger than n. The Annals of Statistics. 2007;35:2313–2351.
-
- Chen J, Chen Z. Extended bayesian information criterion for model selection with large model space. Biometrika. 2008;95:232–253.
Grants and funding
LinkOut - more resources
Full Text Sources
Other Literature Sources