. 2017 Mar 3:8:219.
doi: 10.3389/fimmu.2017.00219. eCollection 2017.

Methylation of FOXP3 TSDR Underlies the Impaired Suppressive Function of Tregs from Long-term Belatacept-Treated Kidney Transplant Patients

Affiliations

Methylation of FOXP3 TSDR Underlies the Impaired Suppressive Function of Tregs from Long-term Belatacept-Treated Kidney Transplant Patients

Evelyn Katy Alvarez Salazar et al. Front Immunol. .

Abstract

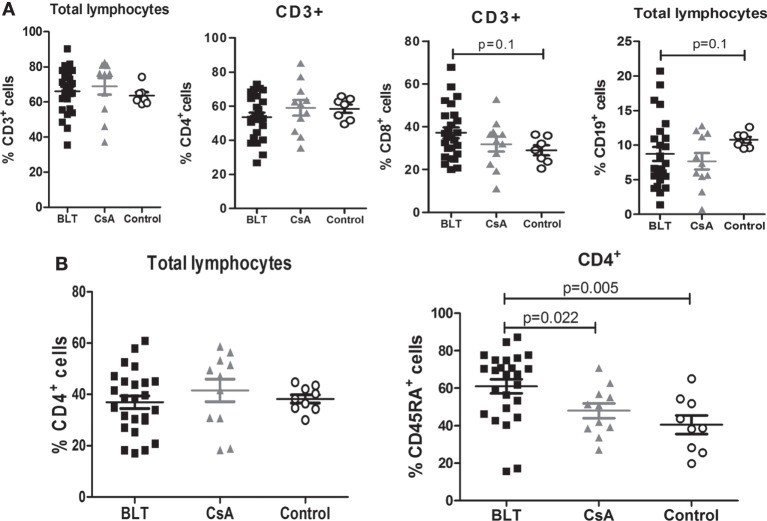
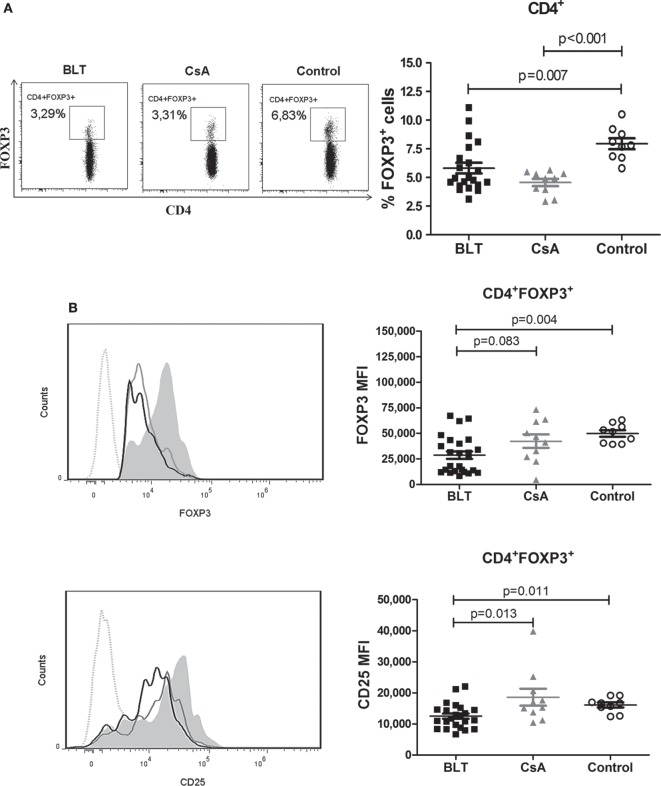
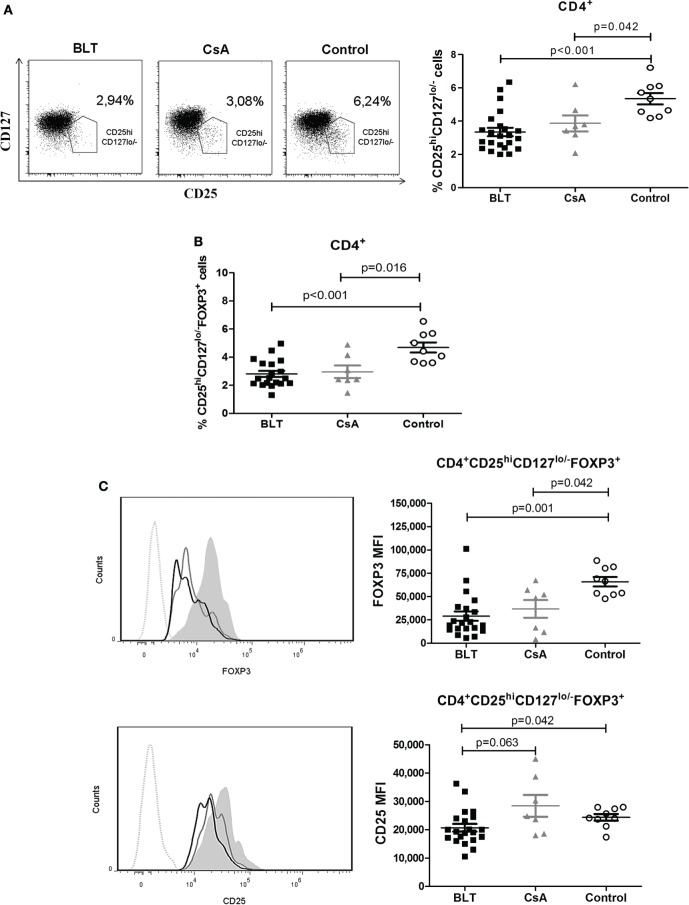
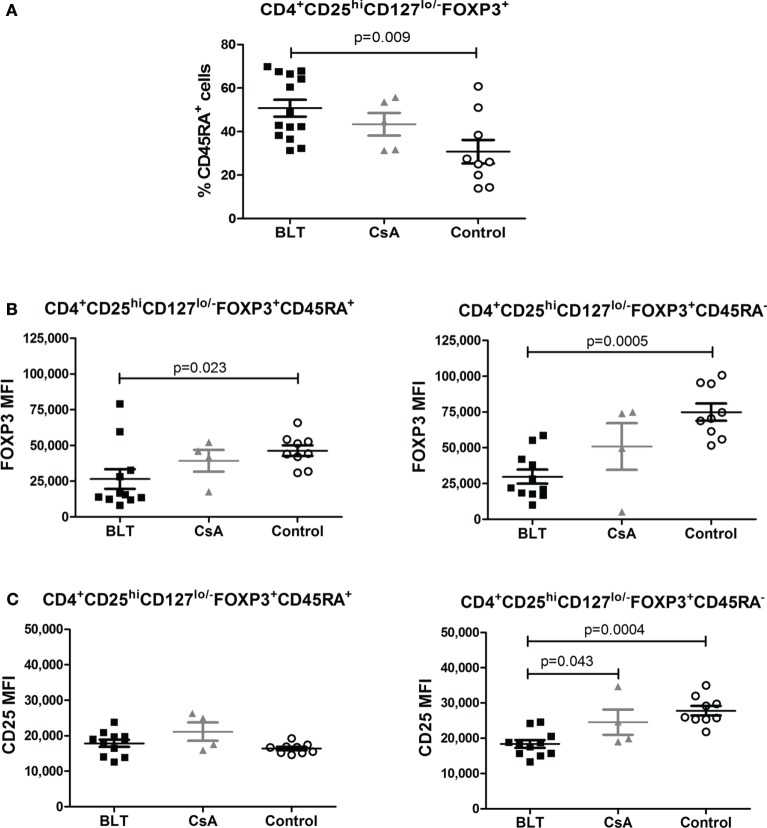
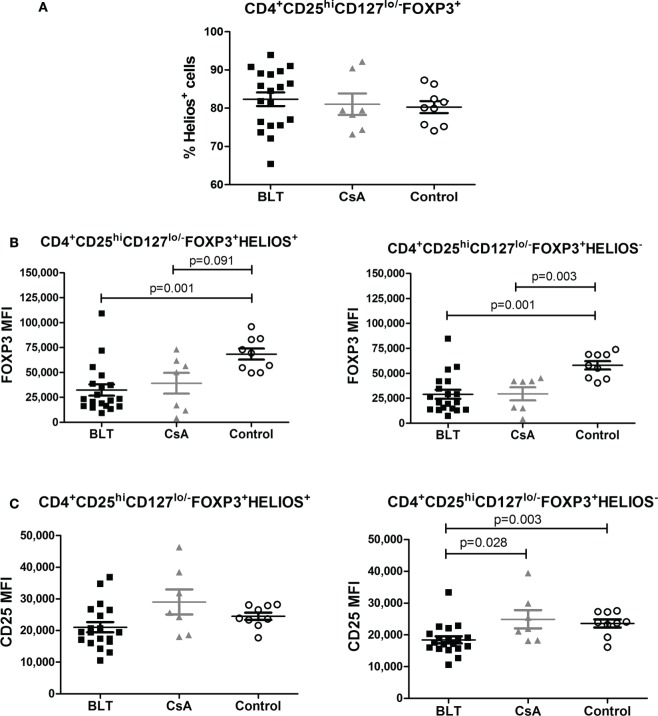
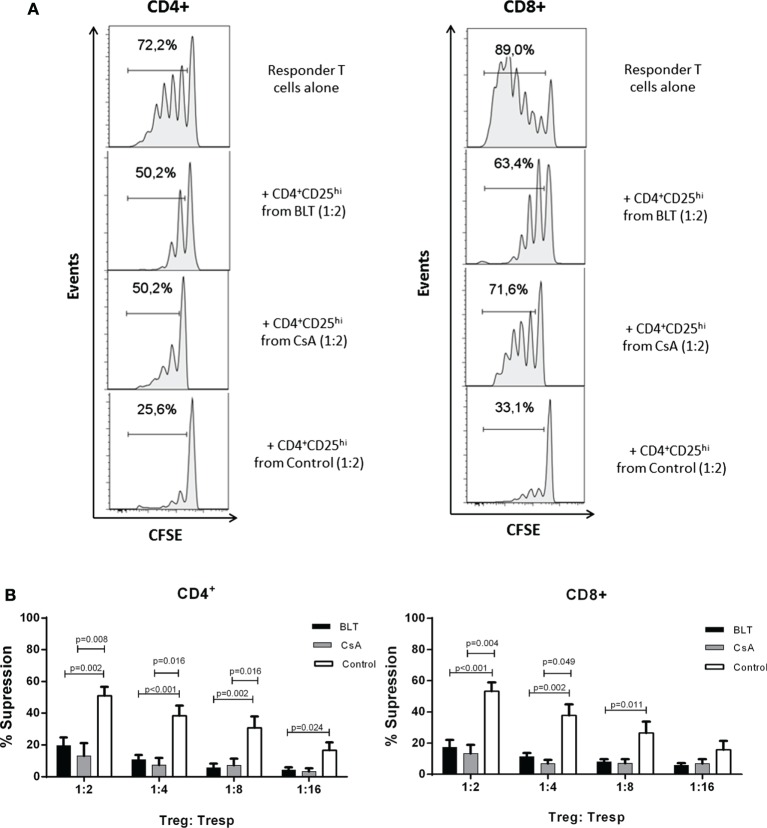
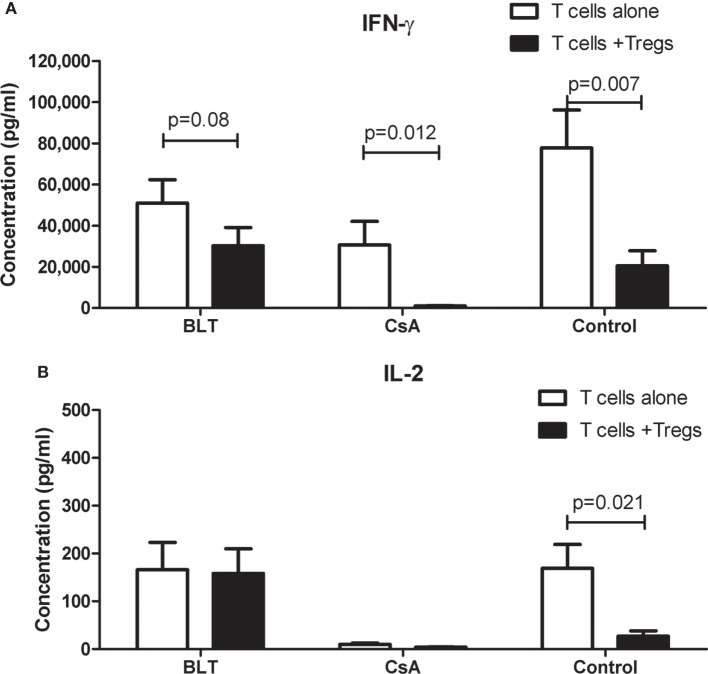
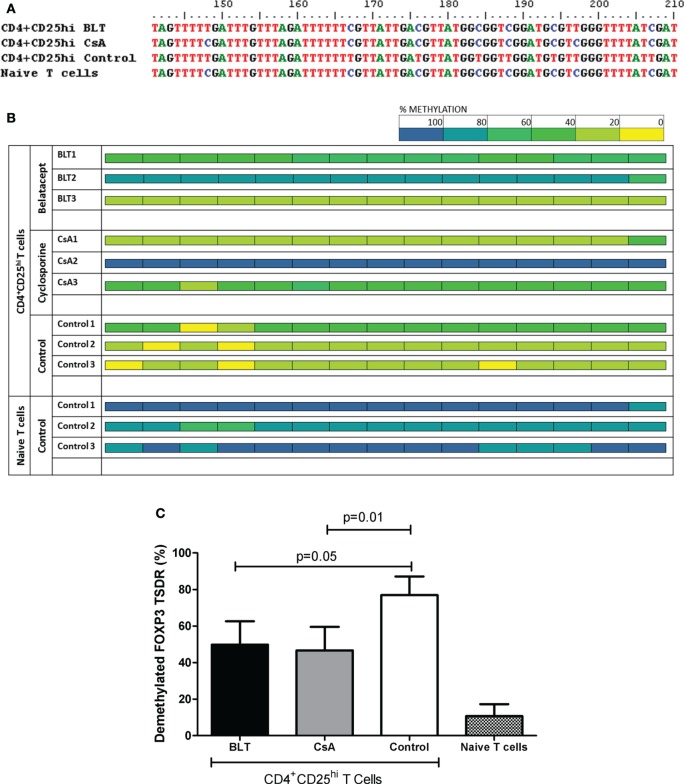
Regulatory T cells (Tregs) are considered key players in the prevention of allograft rejection in transplanted patients. Belatacept (BLT) is an effective alternative to calcineurin inhibitors that appears to preserve graft survival and function; however, the impact of this drug in the homeostasis of Tregs in transplanted patients remains controversial. Here, we analyzed the phenotype, function, and the epigenetic status of the Treg-specific demethylated region (TSDR) in FOXP3 of circulating Tregs from long-term kidney transplant patients under BLT or Cyclosporine A treatment. We found a significant reduction in the proportion of CD4+CD25hiCD127lo/-FOXP3+ T cells in all patients compared to healthy individual (controls). Interestingly, only BLT-treated patients displayed an enrichment of the CD45RA+ "naïve" Tregs, while the expression of Helios, a marker used to identify stable FOXP3+ thymic Tregs remained unaffected. Functional analysis demonstrated that Tregs from transplanted patients displayed a significant reduction in their suppressive capacity compared to Tregs from controls, which is associated with decreased levels of FOXP3 and CD25. Analysis of the methylation status of the FOXP3 gene showed that BLT treatment results in methylation of CpG islands within the TSDR, which could be associated with the impaired Treg suppression function. Our data indicate that analysis of circulating Tregs cannot be used as a marker for assessing tolerance toward the allograft in long-term kidney transplant patients. Trial registration number IM103008.

Keywords: Cyclosporine A; Treg; belatacept; suppression; tolerance; transplantation.


Figures

Figure 1
Figure 1
Increased frequency of naïve CD4+ T cells in BLT-treated patients. (A) Normal percentages of CD3+, CD4+, and CD8+ cells are found in BLT- (n = 24) and CsA- (n = 11) treated patients compared to control (n = 9), and a slight reduction of B (CD19+) cells is observed in BLT-treated patients. (B) Analysis of naïve T cell populations by the expression of CD45RA marker shows a significant increase in the frequency of CD4+CD45RA+ naïve T cells in BLT compared to CsA-treated kidney transplant patients and controls. Statistical analysis was performed using non-parametric Mann–Whitney test, two tailed. BLT, belatacept; CsA, Cyclosporine A. Control group was composed by healthy individuals.
Figure 2
Figure 2
CD4+ T cells from BLT-treated patients show a diminished frequency of FOXP3+ subset with reduced levels of FOXP3 and CD25. (A) A reduced frequency of CD4+FOXP3+ T cells was found in patients under BLT (n = 21) and CsA (n = 10) treatment compared to controls (n = 9). Lefts panels show representative dot plots from patients and controls. (B) Levels of FOXP3 and CD25 expression within the CD4+ subpopulations, were calculated as mean fluorescence intensity (MFI), showing a significant reduction in BLT-treated patients compared to CsA and control group. Left panels show representative histograms from BLT (black solid line), CsA (gray solid line), and control (filled histogram) individual; dotted line denotes fluorescence minus one control. MFI values from each individual were calculated by subtracting the MFI values of the non-expressing subpopulation for each marker from the corresponding expressing subpopulation. Statistical analysis was performed using non-parametric Mann–Whitney test, two tailed. BLT, belatacept; CsA, Cyclosporine A. Control group was composed by healthy individuals.
Figure 3
Figure 3
Peripheral CD4+CD25hiCD127lo/−FOXP3+ T cells [regulatory T cells (Tregs)] from kidney transplant patients showed a reduction in frequency and expression levels of FOXP3. (A) Reduced frequency of CD4+CD25hiCD127lo/− T cells in long-term kidney transplant patients (BLT = 12 and CsA = 7) versus controls (n = 9). Right panels show representative dot plots from patients and controls. (B) Reduction in the percentage of CD4+CD25+CD127lo/−FOXP3+ T cells in compared to controls. (C) Expression of markers characteristic of the Treg phenotype demonstrates a significant reduction of FOXP3 and CD25 in Tregs from BLT-treated patients. Left panels show representative histograms from BLT (black solid line), CsA (gray solid line), and control (filled histogram) individual; dotted line is a fluorescence minus one control. Mean fluorescence intensity (MFI) values from each individual were calculated by subtracting the MFI values of the non-expressing subpopulation for each marker from the corresponding expressing subpopulation. Statistical analysis was performed using non-parametric Mann–Whitney test, two tailed. BLT, belatacept; CsA, Cyclosporine A; control group was composed by healthy individuals.
Figure 4
Figure 4
Reduced FOXP3 expression on BLT regulatory T cells (Tregs) is not a consequence of the accumulation of Tregs with naïve phenotype. Patients under BLT treatment showed an increase frequency of naïve Tregs (A); however, a reduced expression of FOXP3 (B) was found in both naïve (CD45RA+) and activated (CD45RA) Tregs from patients under BLT (n = 14) treatment compared to CsA (n = 4) and controls (n = 9). (C) CD25 expression was significantly reduced in activated but not naïve Tregs from BLT patients. Statistical analysis was performed using non-parametric Mann–Whitney test, two tailed. BLT, belatacept; CsA, Cyclosporine A. Control group was composed by healthy individuals.
Figure 5
Figure 5
FOXP3 expression is reduced in regulatory T cells (Tregs) from BLT-treated patients independently of Helios expression. (A) No differences in the frequency of Helios+ on Tregs population from the three evaluated groups. (B) Reduced expression of FOXP3 within Helios+ (left panel) or Helios Tregs (right panel) of transplanted patients (BLT = 19 and CsA = 7) compared with control group (n = 9). (C) CD25 expression was significantly reduced in Helios but not in Helios+ Tregs from BLT patients. Statistical analysis was performed using non-parametric Mann–Whitney test, two tailed. BLT, belatacept; CsA, Cyclosporine A. Control group was composed by healthy individuals.
Figure 6
Figure 6
Impaired suppressive function of regulatory T cells (Tregs) from kidney transplant patients. (A) Histograms show cells proliferation of carboxy fluorescein succinimidyl ester (CFSE)-labeled CD3+ T cells in the absence (responder T cells alone) or presence of Tregs (CD4+CD25veryhi gated) from kidney transplant patients (BLT and CsA) or healthy subjects (control), numbers indicate the percentage of dividing cells. One representative experiment is presented. (B) CD4+CD25hi T cells (Treg) isolated from BLT- (black bars, n = 9) or CsA- (gray bars, n = 4) treated patients showed impaired suppression of both autologous responder CD4+ and CD8+ T cell (Tresp) proliferation at all evaluated Tregs:Tresp ratios, compared to controls (white bars, n = 8). There were no significant differences between Tregs from BLT- and CsA-treated patients. Suppression was calculated as relative inhibition using the following formula: [(Tresp proliferation without Tregs − Tresp proliferation with Tregs)/Tresp proliferation without Tregs] × 100. Statistical analysis was performed using non-parametric Mann–Whitney test, two tailed. BLT, belatacept; CsA, Cyclosporine A.
Figure 7
Figure 7
IFN-γ and IL-2 production in suppression cocultures from kidney transplant patients. Cytokines were measured in the supernatant cultures of suppression assays from kidney transplant patients (BLT = 3 and CsA = 4) and controls (n = 4), after a stimulus with beads CD3/CD28 (responder T cells alone) or cocultured with autologous regulatory T cells (Tregs) by 4 days. (A) Responder T cells alone from transplanted individuals produce IFN-γ after CD3/CD28 stimulus in the same way of controls, and this production is reduced in the presence of autologous Tregs. Tregs from BLT-treated patients slightly reduced IFN-γ production by activated T cells. (B) Alterations in IL-2 production were observed in transplanted individuals compared with controls. Responder T cells alone from BLT but not CsA-treated patients produce normal levels of IL-2. Statistical analysis was performed using non-parametric Mann–Whitney test, two tailed. BLT, belatacept; CsA, Cyclosporine A. Control group was composed by healthy individuals.
Figure 8
Figure 8
Altered methylation in the regulatory T cell (Treg) FOXP3 TSDR from kidney transplant patients. Sequence analysis of the TSDR region of the FOXP3 gene from BLT, CsA, or controls (three male individuals per group, five clones per individual). (A) After bisulfite treatment, all demethylated CpG cytosines (blue) convert to thymines (red), as seen with CD4+CD25hi Tregs from the control (CD4+CD25veryhi gated). By contrast, naïve T cells display a completely methylated TSDR and were used as negative control. Data from representative individuals from each group are shown. (B) The panel shows the methylation status of the TSDR FOXP3 in the indicated T cells from the three evaluated groups (three individuals per group). Each square represents one CpG analyzed, data are presented as mean percentage methylation of five clones per individual. Methylation color code ranges from yellow (0% methylation) to blue (100% methylation) according to the color scale (upper right). (C) Percentage of demethylation from each evaluated group, represented as the ratio between the numbers of demethylated cytosines and the total number of sequenced CpG sites within the TSDR region.

References

    1. Nankivell BJ, Alexander SI. Rejection of the kidney allograft. N Engl J Med (2010) 363(15):1451–62.10.1056/NEJMra0902927 - DOI - PubMed
    1. Saeed B. Pediatric renal transplantation. Int J Organ Transplant Med (2012) 3(2):62–73. - PMC - PubMed
    1. Sayegh MH, Turka LA. The role of T-cell costimulatory activation pathways in transplant rejection. N Engl J Med (1998) 338(25):1813–21.10.1056/NEJM199806183382506 - DOI - PubMed
    1. Vincenti F, Charpentier B, Vanrenterghem Y, Rostaing L, Bresnahan B, Darji P, et al. A phase III study of belatacept-based immunosuppression regimens versus cyclosporine in renal transplant recipients (BENEFIT study). Am J Transplant (2010) 10(3):535–46.10.1111/j.1600-6143.2009.03005.x - DOI - PubMed
    1. Masson P, Henderson L, Chapman JR, Craig JC, Webster AC. Belatacept for kidney transplant recipients. Cochrane Database Syst Rev (2014) 11:CD010699.10.1002/14651858.CD010699.pub2 - DOI - PMC - PubMed