. 2017 Mar 3:8:287.
doi: 10.3389/fpls.2017.00287. eCollection 2017.

Expression of 16 Nitrogenase Proteins within the Plant Mitochondrial Matrix

Affiliations

Expression of 16 Nitrogenase Proteins within the Plant Mitochondrial Matrix

Robert S Allen et al. Front Plant Sci. .

Abstract

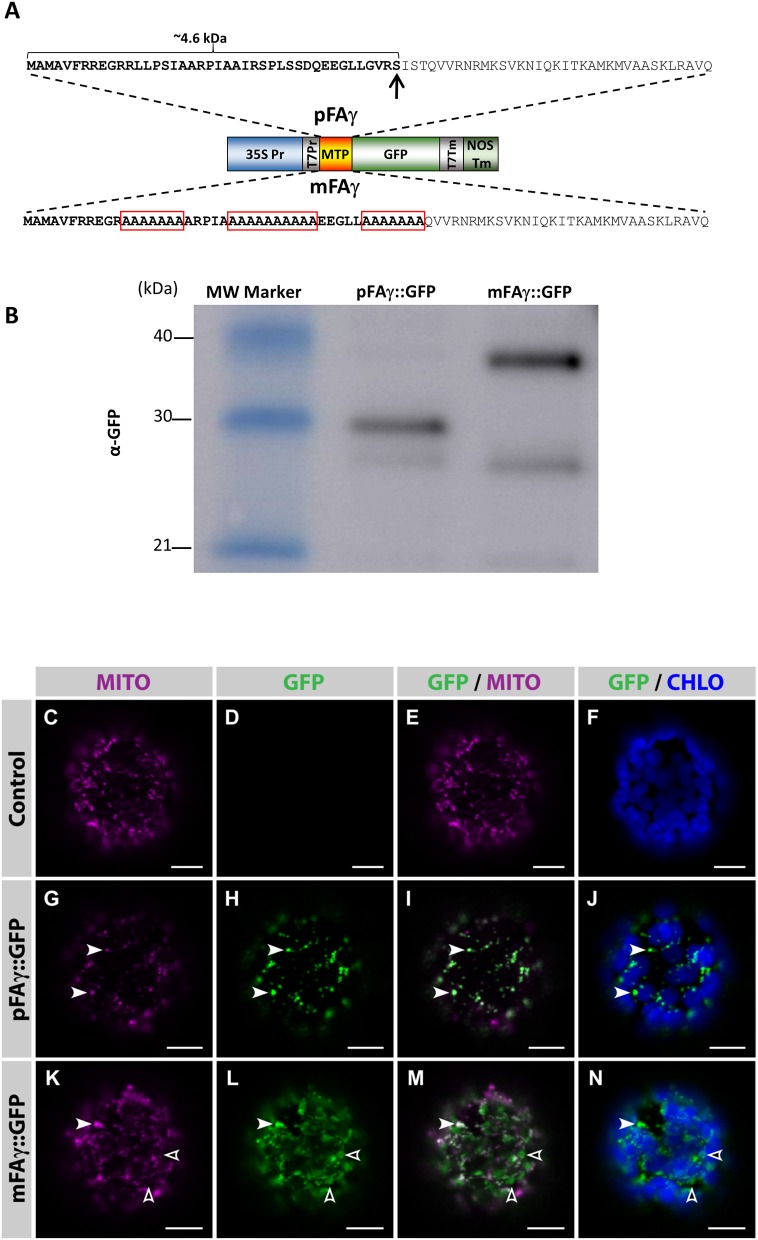
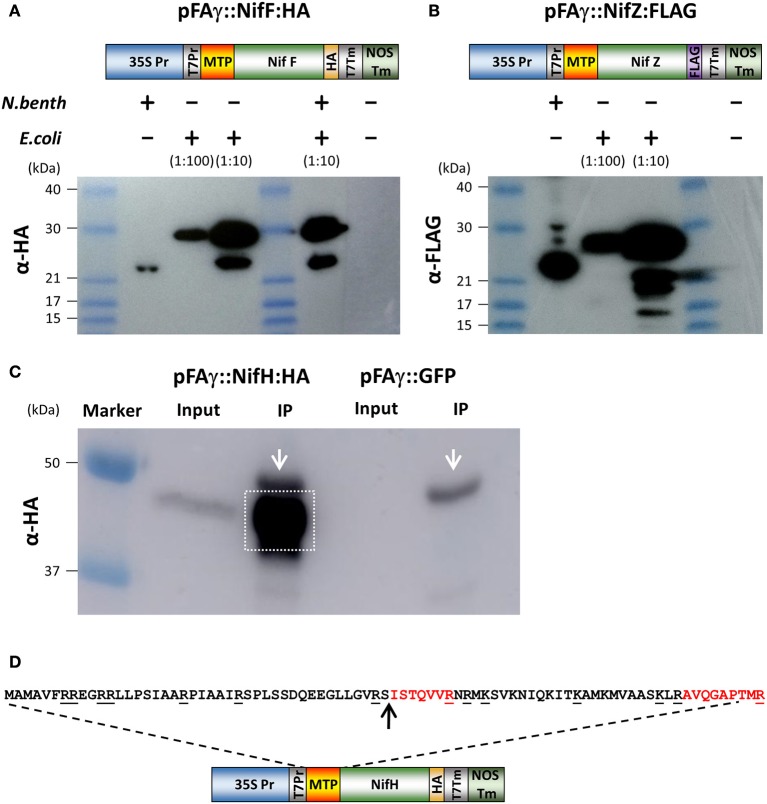
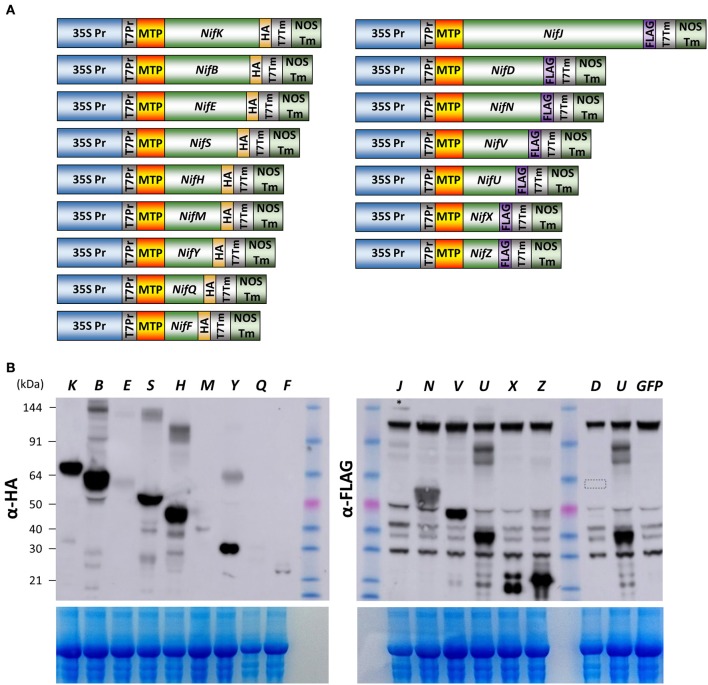
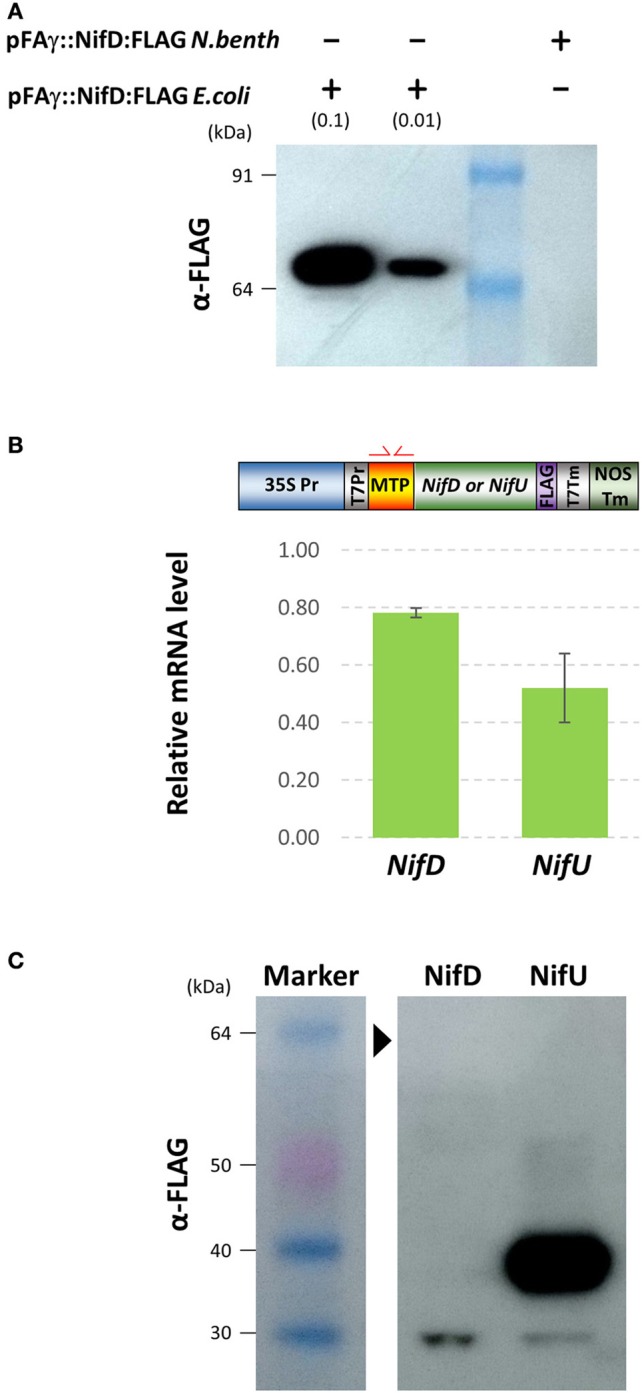
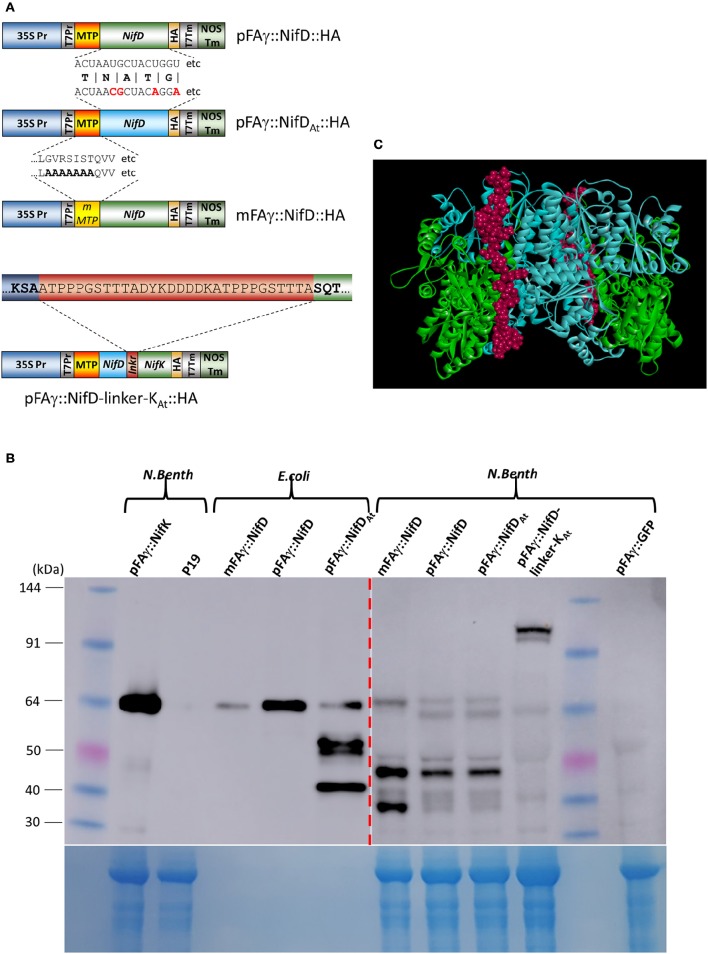
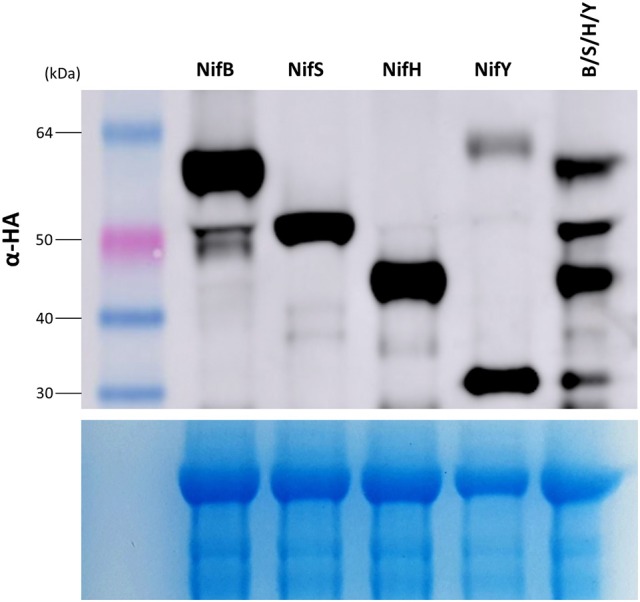
The industrial production and use of nitrogenous fertilizer involves significant environmental and economic costs. Strategies to reduce fertilizer dependency are required to address the world's increasing demand for sustainable food, fibers, and biofuels. Biological nitrogen fixation, a process unique to diazatrophic bacteria, is catalyzed by the nitrogenase complex, and reconstituting this function in plant cells is an ambitious biotechnological strategy to reduce fertilizer use. Here we establish that the full array of biosynthetic and catalytic nitrogenase (Nif) proteins from the diazotroph Klebsiella pneumoniae can be individually expressed as mitochondrial targeting peptide (MTP)-Nif fusions in Nicotiana benthamiana. We show that these are correctly targeted to the plant mitochondrial matrix, a subcellular location with biochemical and genetic characteristics potentially supportive of nitrogenase function. Although Nif proteins B, D, E, F, H, J, K, M, N, Q, S, U, V, X, Y, and Z were all detectable by Western blot analysis, the NifD catalytic component was the least abundant. To address this problem, a translational fusion between NifD and NifK was designed based on the crystal structure of the nitrogenase MoFe protein heterodimer. This fusion protein enabled equimolar NifD:NifK stoichiometry and improved NifD expression levels in plants. Finally, four MTP-Nif fusion proteins (B, S, H, Y) were successfully co-expressed, demonstrating that multiple components of nitrogenase can be targeted to plant mitochondria. These results establish the feasibility of reconstituting the complete componentry for nitrogenase in plant cells, within an intracellular environment that could support the conversion of nitrogen gas into ammonia.

Keywords: metabolic engineering; mitochondrial targeting; nitrogen fixation; nitrogenase; synthetic biology.


Figures

Figure 1
Figure 1
Validation of the MTP for mitochondrial matrix targeting in N. benthamiana leaves. (A) Schematic diagram of the constructs used to transiently express pFAγ::GFP fusion polypeptides in N. benthamiana leaves. The wild-type pFAγ mitochondrial targeting peptide sequence (MTP) shown above and the mutated version (mFAγ) shown below. Red boxes indicate regions of alanine substitutions. The arrow indicates the predicted point of cleavage by the MPP. 35S Pr, CaMV 35S promoter; T7Pr, T7 RNA polymerase promoter; MTP, pFAγ, or mFAγ region; GFP, GFP polypeptide; T7Tm, T7 RNA polymerase transcription terminator; NOSTm, 3′ transcription terminator/polyadenylation region of the nos gene. (B) Western blot of protein extracts for constructs expressing pFAγ::GFP or mFAγ::GFP fusion polypeptides in N. benthamiana leaves. Molecular weights of the markers in the first lane are indicated. The band in the pFAγ::GFP lane is the cleaved fusion polypeptide, whereas the intense band in the mFAγ::GFP lane is the uncleaved fusion polypeptide. The GFP antibody also produces a second slightly fainter lower band of ~28 kDa. (C–N) Laser scanning confocal microscopy images of protoplasts isolated 3 dpi from N. benthamiana leaves that were either non-infiltrated controls (C–F), or infiltrated with pFAγ::GFP (G–J) or mFAγ::GFP (K–N). In protoplasts expressing pFAγ::GFP (G–J), the GFP signal fully co-localized with MitoTracker (white arrowheads), while in protoplasts expressing mFAγ::GFP (K–N), the GFP signal only partially co-localized with MitoTracker (white arrowheads,) and a large fraction of GFP was mis-targeted to other subcellular areas (empty arrowheads). MITO, MitoTracker fluorescence; GFP, GFP fluorescence; GFP/MITO, overlay of GFP and MitoTracker staining fluorescence; GFP/CHLO overlay of GFP and chloroplast fluorescence. Scale bars: 10 μm.
Figure 2
Figure 2
Expression and processing of mitochondrially targeted Nif proteins in N. benthamiana. (A,B) Schematic of the pFAγ::NifF::HA and pFAγ::NifF::FLAG constructs used for N. benthamiana and E. coli expression, indicating the T7 promoter driving bacterial expression downstream of the 35S promoter for plant expression. Western blot analysis of pFAγ::NifF::HA or pFAγ::NifF::FLAG expression in N. benthamiana and E. coli. The + and − symbols above the lanes indicate the presence or absence, respectively, of N. benthamiana or E. coli protein extracts applied to the lanes; the extract dilution factors used for the bacterial extracts are indicated in brackets. (C) Image of Western blot for protein concentration of pFAγ::NifF::HA by anti-HA immunoprecipitation. Original protein extracts (Input) and IP eluate (IP) are shown. Background signal from the large-chain subunit of the HA antibody is marked with white arrow. The gel area excised for protein microsequencing is indicated by the white box. (D) Schematic of the construct used to transiently express pFAγ::NifH::HA in N. benthamiana. Underlined residues in the nucleotide sequence indicate sites of proteolytic cleavage (carboxyl side) by trypsin. The arrow indicates the point of cleavage by the mitochondrial processing peptidase (MPP). The peptides ISTQVVR and AVQGAPTMR were detected by mass spectrometry.
Figure 3
Figure 3
Expression of 15 Nif proteins in the mitochondrial matrix of N. benthamiana. (A) Schematics of the constructs used for pFAγ::Nif::HA and pFAγ::Nif::FLAG expression in N. benthamiana. Only the Nif inserts are relatively proportional to their sequence length. (B) Image of Western blot probed with antibody for HA (upper left panel) or FLAG (upper right panel) after SDS-PAGE of protein extracts from N. benthamiana cells expressing constructs encoding pFAγ::Nif::HA or pFAγ::Nif::FLAG fusion polypeptides. The letters above the lanes (K, B, E, S etc.) indicate the Nif polypeptide included in the fusion polypeptide encoded by the genetic construct. The faint band near the top of the blot for pFAγ::NifJ::FLAG is indicated by an asterisk (*). A small box in the Lane “D” highlights the region of the blot where a signal for pFAγ::NiD::FLAG would be expected. The extreme right lane GFP indicates a sample extracted from a pFAγ::GFP infiltrated region as a negative control for background bands inherent to the FLAG epitope in these assays. The size of the molecular weight markers (kDa) are indicated to the left, and the same markers were used in both HA and FLAG panels. The expected sizes for processed and unprocessed proteins are shown in Supplementary Table 1. The lower panels show the corresponding gels after Coomassie staining as an indication of protein loading.
Figure 4
Figure 4
Expression of MTP-NifD-FLAG is undetectable in N.benthamiana despite high relative mRNA expression. (A) Western blot of anti-FLAG for pFAγ::NifD::FLAG transformed E. coli or N. benthamiana. The blot was probed with the antibody against the FLAG epitope. The molecular weights of the markers in the first lane are indicated. The + and − symbols above the lanes indicate the presence or absence, respectively, of N. benthamiana or E. coli protein extracts applied to the lanes; the extract dilution factors used for the bacterial extracts are indicated in brackets. (B) qRT-PCR analysis of pFAγ::Nif::FLAG transgene expression. Schematic above shows the primers annealing in the MTP region. Expression values were normalized to GADPH, with measurements being the average of three replicates and error bars representing the standard error of the mean. (C) Image of Western blot using anti-FLAG for protein extracts prepared from N. benthamiana leaf samples 4 days after infiltration with either pFAγ::NifD::FLAG or pFAγ::NifU::FLAG. Black arrowhead indicates the expected position for a pFAγ::NifD::FLAG band. Protein marker sizes are indicated on left hand side of image.
Figure 5
Figure 5
Improved expression of NifD polypeptide fusions in N. benthamiana. (A) Schematics of the various NifD constructs used for expression analysis. Examples of RNA or protein sequence differences are shown; protein sequences for pFAγ::NifD::HA and pFAγ::NifDAt::HA are identical, but the codon usages for the NifD coding regions vary, only the first 18 nucleotides with differences in bold red are shown for space. mMTP indicates the region encompassing the mFAγ MTP, which contains alanine substitutions identical to mFAγ::GFP for disruption of mitochondrial matrix translocation. For pFAγ::NifD-linker-NifK::HA, the entire linker is shown in the red bar, flanked by the NifD (blue) and NifK (green) sequences. (B) Western blot analysis of protein extracts from cells expressing Nif polypeptide fusions and probed with anti-HA. Proteins extracts were prepared from either E. coli or N. benthamiana indicated by bracketed areas above the blot. The image output levels were adjusted on the right hand side of the blot (shown by red dashed arrow) to prevent oversaturation by E. coli bands (original image shown in Supplementary Figure 2). The corresponding Coomassie-stained gel is shown underneath as an indication of protein loading, noting that bacterial extracts have a different total protein profile from that in leaf extracts. (C) In silico representation of the structure of NifD-linker-NifK shown as the α2β2 heteroteramer. The blue residues are NifD, green residues NifK and the linker displayed as red.
Figure 6
Figure 6
Stacking of multiple Nif proteins in the mitochondrial matrix of N. benthamiana. (Upper panel) Western blot of protein extracts for constructs expressing pFAγ::Nif::HA either singly (NifB, NifS, NifH, NifY), or as a combination of the same four individual Agrobacterium cultures infiltrated in an equimolar mixture of NifB, S, H, Y. Sizes of markers are indicated on left. The corresponding Coomassie-stained gel is shown in the (lower panel), indicating even loading across all lanes.

References

    1. Allen R. S., Li J., Alonso-Peral M. M., White R. G., Gubler F., Millar A. A. (2010). MicroR159 regulation of most conserved targets in Arabidopsis has negligible phenotypic effects. Silence 1, 18–18. 10.1186/1758-907X-1-18 - DOI - PMC - PubMed
    1. Balk J., Pilon M. (2011). Ancient and essential: the assembly of iron-sulfur clusters in plants. Trends Plant Sci. 16, 218–226. 10.1016/j.tplants.2010.12.006 - DOI - PubMed
    1. Becker T., Böttinger L., Pfanner N. (2012). Mitochondrial protein import: from transport pathways to an integrated network. Trends Biochem. Sci. 37, 85–91. 10.1016/j.tibs.2011.11.004 - DOI - PubMed
    1. Campbell P. M., Trueman H. E., Zhang Q., Kojima K., Kameda T., Sutherland T. D. (2014). Cross-linking in the silks of bees, ants and hornets. Insect Biochem. Mol. Biol. 48, 40–50. 10.1016/j.ibmb.2014.02.009 - DOI - PubMed
    1. Case D. A., Darden T. A., Cheatham T. E., Simmerling C. L., Wang J., Duke R. E., et al. (2012). AMBER 12. San Francisco, CA: University of California.