. 2017 Mar 20:8:14728.
doi: 10.1038/ncomms14728.

DNA damage during S-phase mediates the proliferation-quiescence decision in the subsequent G1 via p21 expression

Affiliations

DNA damage during S-phase mediates the proliferation-quiescence decision in the subsequent G1 via p21 expression

Alexis R Barr et al. Nat Commun. .

Abstract

Following DNA damage caused by exogenous sources, such as ionizing radiation, the tumour suppressor p53 mediates cell cycle arrest via expression of the CDK inhibitor, p21. However, the role of p21 in maintaining genomic stability in the absence of exogenous DNA-damaging agents is unclear. Here, using live single-cell measurements of p21 protein in proliferating cultures, we show that naturally occurring DNA damage incurred over S-phase causes p53-dependent accumulation of p21 during mother G2- and daughter G1-phases. High p21 levels mediate G1 arrest via CDK inhibition, yet lower levels have no impact on G1 progression, and the ubiquitin ligases CRL4Cdt2 and SCFSkp2 couple to degrade p21 prior to the G1/S transition. Mathematical modelling reveals that a bistable switch, created by CRL4Cdt2, promotes irreversible S-phase entry by keeping p21 levels low, preventing premature S-phase exit upon DNA damage. Thus, we characterize how p21 regulates the proliferation-quiescence decision to maintain genomic stability.


Conflict of interest statement

The authors declare no competing interests.

Figures

Figure 1
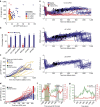
Figure 1. Cells exhibit cell-to-cell variability in p21 expression.
(a) Image of p21-GFP (magenta) and mRuby-PCNA (turquoise) expressing hTert-RPE1 cells. Scale bar is 10 μm. (b) Cell features captured by automated image analysis (Methods) from a single cell expressing mRuby-PCNA and p21-GFP. (c) Single-cell traces of p21-GFP levels aligned to S/G2; n=51 cells. Tracks are coloured according to p21-GFP intensity. Black circles represent mitosis. (d) Correlation between maximum G1 p21-GFP intensity and G1 length (Pearson's Correlation R=0.62** (P<0.01)). Three different 488 nm exposures are shown: Exp1, n=206 cells; Exp2, n=90; Exp3, n=52 (Methods). (e) Correlation in G1 p21-GFP levels between sister cells—G1 Daughter1 (G1D1) and G1 Daughter2 (G1D2; n=62, Pearson's Correlation R=0.81** (P<0.01)). Data points are coloured to represent correlation between G1 length in each daughter cell, calculated as the difference between the maximum and minimum G1 length divided by the sum of the sister G1 lengths, n=62. (f) Single-cell traces of p21-GFP levels aligned to mitotic exit; n=51 cells. Grey line marks 600 min time point used to define G1pm arrest. Red curves are cells that enter a G1pm arrest, blue curves are cells that enter S-phase (cycle). (g) Mean p21-GFP intensity in G2M separated by daughter cell fate: cycling, n=49 cells; single arrest, n=9; twin arrest, n=10. Significant differences are observed between arrested and cycling states using a two-sample t-test on log-transformed data. Error bar is s.d. *P<0.05, **P<0.01.
Figure 2
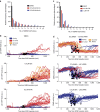
Figure 2. p53 drives p21 heterogeneity in unperturbed conditions.
(a) p21-GFP levels versus G1 length after siRNA treatment: control siRNA (blue), n=75 cells; p53 siRNA (yellow), n=81; or p21 siRNA (red), n=90. (b) Percentage of cells arresting in G1 for three siRNA treatments and for p21WT versus two p21KO clones. Number of cells is shown above each bar. Red bars represent cells that enter G1pm arrest, blue bars are cells that enter S-phase (cycle). (c) Single-cell traces of p21-GFP levels after 5 μM Nutlin-3 addition: S-phase on addition, yellow, n=8 cells; G1 on addition, blue, n=8. Time of mitosis is marked by black circles and time of S-phase entry is marked by blue circles on each single-cell trace. (d) Effect of rate of p21-GFP accumulation on G2 entry after Nutlin-3 addition to cells in S-phase. Black circles represent mitosis. Arrest, red, n=19 cells; Mitosis, blue, n=28. (e) CDK2 activity profiles aligned to mitosis for: control siRNA, n=51 cells; p21 siRNA, n=68 cells; and p53 siRNA, n=25 cells. Red curves represent CDK2low cells. Black circles represent time of S-phase entry. (f) Single-cell trace of CDK2 activity and p21-GFP levels in an unperturbed cell. Brown shading is G2. Grey shading shows a period in G1 where CDK2 activity is increasing despite expression of p21-GFP. Traces aligned to S-phase entry at t=0 min. p21-GFP levels are shown in green and CDK2 activity is shown in red. (g) Single-cell trace of CDK2 activity and p21-GFP levels in an unperturbed cell arrested in G1. p21-GFP levels are shown in green and CDK2 activity is shown in red. Note: different scale for p21-GFP y-axis compared to (f).
Figure 3
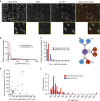
Figure 3. Basal p21 expression correlates with the presence of DNA damage foci.
(a) Images of hTert-RPE1 mRuby-PCNA p21-GFP cells fixed and stained for γH2AX. Magnified regions of each image are also shown. p21-GFP is green, γH2AX is red in merged images. Scale bars are 10 μm. (b) Quantification of p21-GFP nuclear fluorescence in interphase (excluding S-phase) cells with or without γH2AX nuclear foci. With foci, n=2086 cells; without foci, n=12476. (c) Quantification of number of γH2AX foci per nucleus after separation of cells based on a high or low p21-GFP nuclear fluorescence (high p21>30 a.u.). High p21-GFP, n=3896 cells; low p21-GFP, n=11049. (d) Fates of sister cells pairs (D1 and D2) with regards to 53BP1 focus appearance. 142 daughter pairs were analysed. (e) Correlation between the time of 53BP1 focus appearance in sister cells. 45 sister pairs are shown. Note: 14 sister pairs are clustered at time 0,0 min and are not visible as separate values. Pearson's Correlation R=0.39* (P<0.05). (f) Histogram of G1 length separated by the presence or absence of a 53BP1-GFP focus. The difference between the two populations is significant (unpaired student's t-test P=0.0003). 118 cells were scored manually.
Figure 4
Figure 4. Impaired DNA replication can induce p21 expression.
(a) Number of γH2AX foci per nucleus in cells treated with DMSO or aphidicolin for 24 h. DMSO, n=1527 cells; 0.3 μM Aph, n=775; 0.6 μM Aph, n=745. (b) Single-cell traces of p21-GFP expression after treatment of asynchronous cells with: DMSO, n=38; 0.3 μM aphidicolin, n=32; or 0.5 μM ATRi, n=40. All traces are aligned to S-phase exit. Black circles represent mitosis. Blue curves represent cells that enter S-phase, red curves represent cells that arrest in G1 and yellow curves represent cells that arrest in G2. (c) Number of γH2AX foci per nucleus in cells treated with DMSO or ATRi for 24 h. n=1527, DMSO; n=1420, 0.5 μM ATRi; n=1467, 1 μM ATRi. (d) CDK2 activity profiles in cells treated with 0.3 μM aphidicolin and: n=34, DMSO; n=32, p53; and n=42, p21 siRNA, aligned to S/G2. Black circles represent mitosis. Blue curves represent cells that enter S-phase, red curves represent cells that arrest in G1 and yellow curves represent cells that arrest in G2.
Figure 5
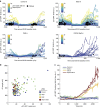
Figure 5. Skp2- and Cdt2-dependent pathways degrade p21 with different rates and timings.
(a) Single-cell traces, coloured by p21-GFP intensity in G1, aligned to the G1/S transition. Four siRNA treatments are shown: n=65 cells, control; n=81, Skp2; n=37, Cdt2; n=25, Skp2 and Cdt2 co-depletion. Black circles represent mitosis. Note: only cells entering S-phase are shown. (b) Graph shows correlation between p21-GFP intensity and G1 length for each siRNA condition shown in (a): n=50 cells, control; n=54, Skp2; n=9, Cdt2; n=14, Skp2 and Cdt2 co-depletion. (c) Graph shows average p21-GFP nuclear level across FOV for four different siRNA treatments. Four FOVs are shown for control siRNA cells and two FOVs are shown for the other treatments, each curve is one FOV. Control siRNA is shown in blue, Skp2 siRNA is shown in green, Cdt2 siRNA is shown in yellow and double Skp2 and Cdt2 depletion is shown in red.
Figure 6
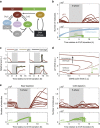
Figure 6. Two double-negative feedback loops control p21 degradation.
(a) Influence diagram of the p21 regulatory network. p21 is engaged in two mutually inhibitory motifs with CDK2:Cyclin and aRCs. CDK2 activity primes replication complexes (pRC) for PCNA loading, which facilitates S-phase entry and DNA synthesis by aRCs. The latter can cause DNA damage and p53 expression, promoting p21 synthesis and DNA repair. (b) Stochastic simulation of p21 (top), and total CDK2:Cyclin and aRCs (bottom), relative to the G1/S transition; n=10. Grey shaded regions indicate S-phase. (c) Relative level of p21, p53 and DNA damage in four simulated cells. Grey shaded regions indicate S-phase. Note p21 absence in S-phase even in cells that suffer damage (for example, lower right). (d) Stable (solid) and unstable (dashed) steady states of p21 with respect to the total level of CDK2:Cyclin for increasing DNA damage. The G1/S transition is indicated for intermediate levels of damage. (e) Stochastic simulation of p21 (upper panels) and aRCs (lower panels) in Skp2-depleted (left) and Cdt2-depleted (right) cells; n=10.
Figure 7
Figure 7. Arrest in response to serum starvation is not p21-dependent.
(a) Single-cell traces of p21-GFP levels aligned to mitotic exit (serum was withdrawn in the previous cycle); n=29 cells. Grey line marks 600 min time point used to define G1pm arrest. Red curves represent cells entering G1pm arrest, blue curves represent cells that enter S-phase. (b) Graph showing the percentage of cells arresting in G1 in three different mRuby-PCNA hTert-RPE1 cell lines (WT and two p21KO clones) after serum withdrawal for 24 h. Mean and s.d. of two independent FACS experiments are shown. (c) Model for how p21 propagates information on DNA damage in the mother cell to influence the proliferation-quiescence decision in daughter cells. At intermediate levels of p21 (purple curve) cells still cycle, albeit with a G1 delay that is p53-dependent but p21-independent.

References

    1. Jeggo P. A., Pearl L. H. & Carr A. M. DNA repair, genome stability and cancer: a historical perspective. Nat. Rev. Cancer 16, 35–42 (2016). - PubMed
    1. Kastan M. B., Onyekwere O., Sidransky D., Vogelstein B. & Craig R. W. Participation of p53 protein in the cellular response to DNA damage. Cancer Res. 51, 6304–6311 (1991). - PubMed
    1. Lane D. P. & Crawford L. V. T antigen is bound to a host protein in SY40-transformed cells. Nature 278, 261–263 (1979). - PubMed
    1. el-Deiry W. S. et al.. WAF1, a potential mediator of p53 tumor suppression. Cell 75, 817–825 (1993). - PubMed
    1. el-Deiry W. S. et al.. WAF1/CIP1 is induced in p53-mediated G1 arrest and apoptosis. Cancer Res. 54, 1169–1174 (1994). - PubMed

Publication types

MeSH terms

Substances