. 2017 Mar 20:8:14887.
doi: 10.1038/ncomms14887.

Enhanced biennial variability in the Pacific due to Atlantic capacitor effect

Affiliations

Enhanced biennial variability in the Pacific due to Atlantic capacitor effect

Lei Wang et al. Nat Commun. .

Abstract

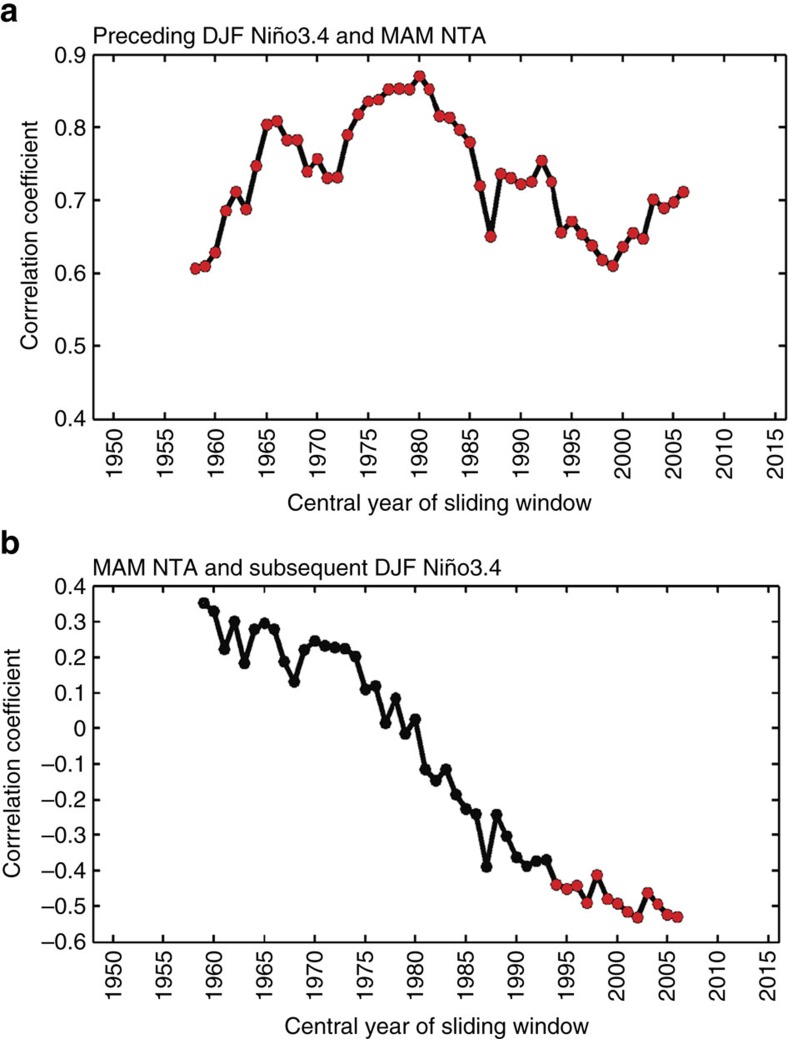
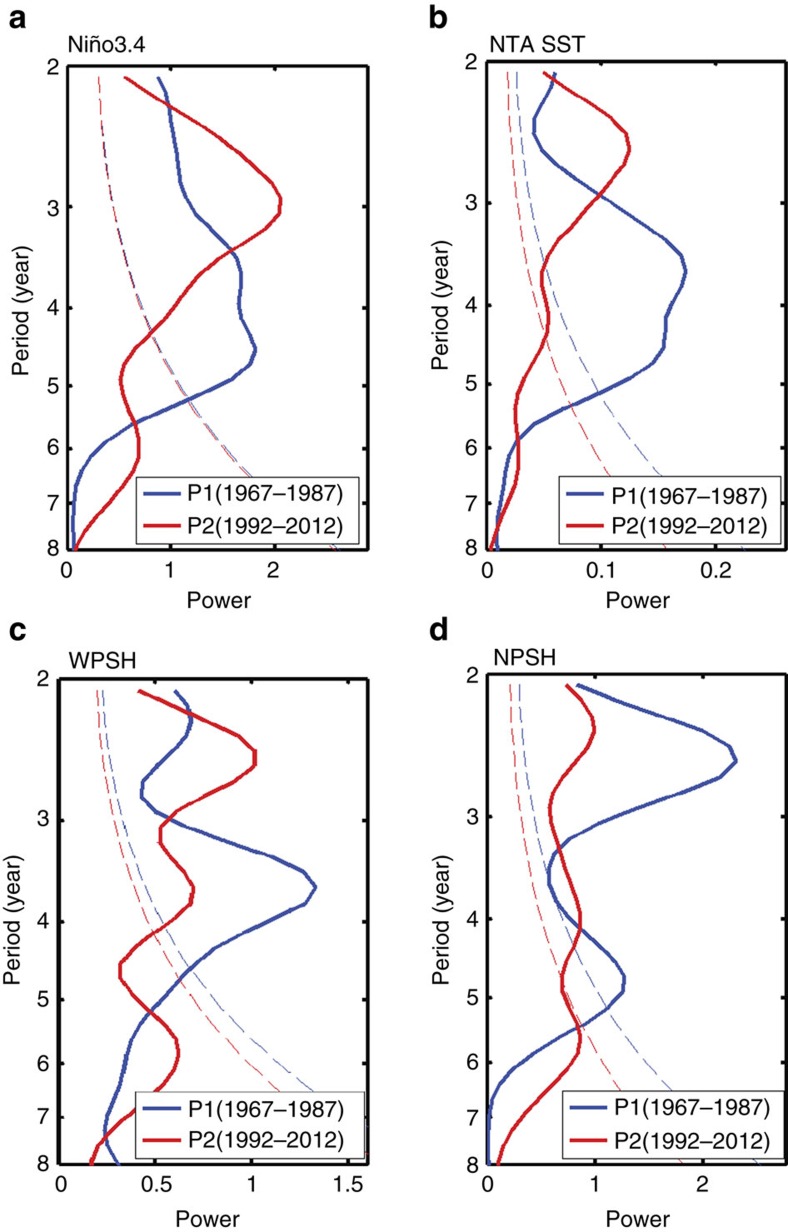
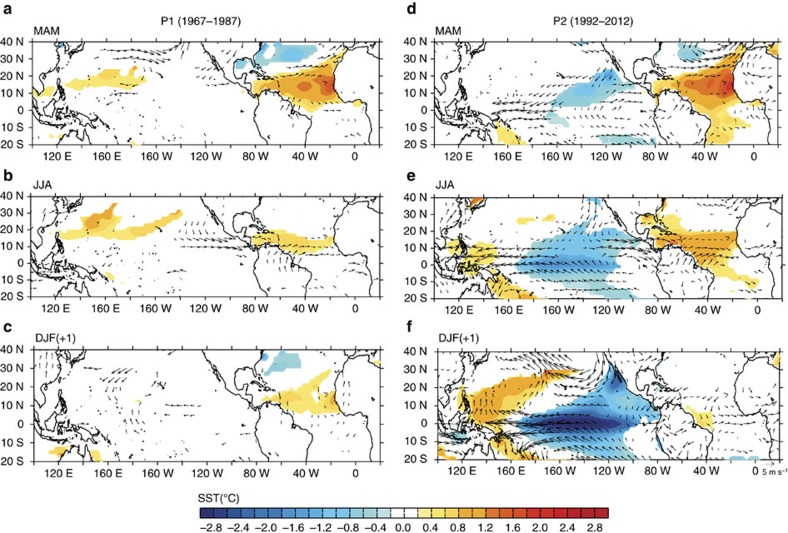
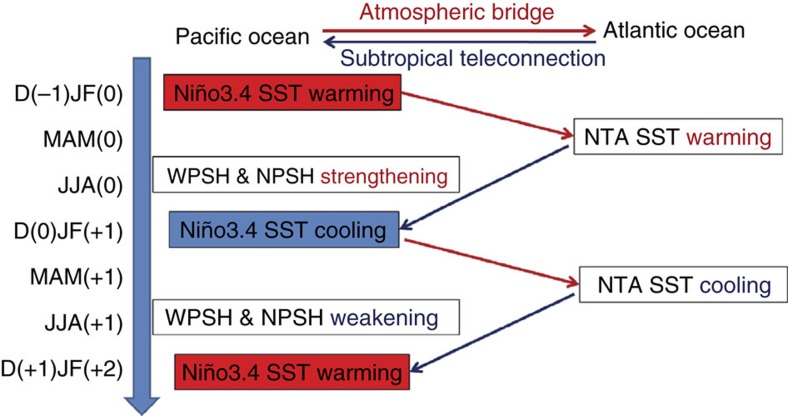
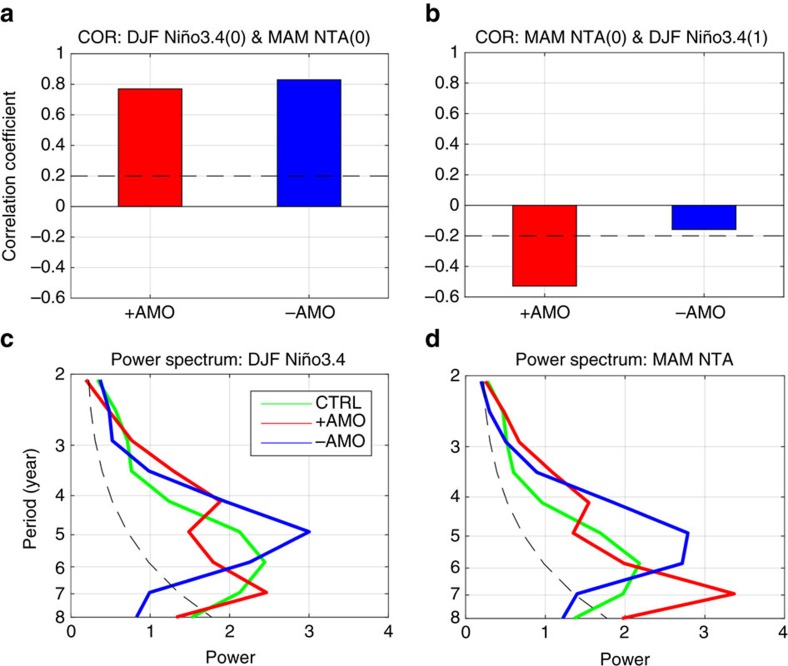
The El Niño-Southern Oscillation (ENSO) and the variability in the Pacific subtropical highs (PSHs) have major impacts on social and ecological systems. Here we present an Atlantic capacitor effect mechanism to suggest that the Atlantic is a key pacemaker of the biennial variability in the Pacific including that in ENSO and the PSHs during recent decades. The 'charging' (that is, ENSO imprinting the North Tropical Atlantic (NTA) sea surface temperature (SST) via an atmospheric bridge mechanism) and 'discharging' (that is, the NTA SST triggering the following ENSO via a subtropical teleconnection mechanism) processes alternate, generating the biennial rhythmic changes in the Pacific. Since the early 1990s, a warmer Atlantic due to the positive phase of Atlantic multidecadal oscillation and global warming trend has provided more favourable background state for the Atlantic capacitor effect, giving rise to enhanced biennial variability in the Pacific that may increase the occurrence frequency of severe natural hazard events.


Conflict of interest statement

The authors declare no competing financial interests.

Figures

Figure 1
Figure 1. Correlations between the ENSO and NTA SST indices.
(a) The 21-year sliding correlation coefficients (for example, correlation coefficient in 2002 representing 1992–2012) between preceding boreal winter (DJF) Niño3.4 and spring (MAM) NTA SST during 1948–2016. (b) Same as a but for MAM NTA SST and subsequent DJF Niño3.4. Following ref. , the impact of the previous winter ENSO has been excluded in b by removing the linear regression with respect to the Niño3.4 index during the previous DJF season. The linear trend has been removed within each sliding window for both indices before calculating the sliding correlation coefficients. The red dots represent correlations that are significant at the 95% confidence level.
Figure 2
Figure 2. Comparison of power spectrum for climatic indices before and after the early 1990s.
(ad) Distribution of power spectrum for DJF Niño3.4 index (a), MAM NTA SST (b), JJA WPSH index (c) and JJA NPSH index (d). The dashed line denotes the 95% confidence interval against red noise.
Figure 3
Figure 3. Regression with respect to spring NTA SST.
(ac) Regressions of SSTAs (shading) and 850-hPa winds (vector) with respect to the MAM NTA SST during P1 for MAM (a), JJA (b) and DJF (c) seasons. (df) Same as ac but for during P2 for MAM (d), JJA (e) and DJF (f) seasons. The impact of the previous winter ENSO has been excluded by removing the linear regression with respect to the Niño3.4 index during the previous DJF season. Only the values at the 90% confidence level or higher are shown.
Figure 4
Figure 4. A schematic diagram showing the biennial cycle of the ENSO induced by the Atlantic capacitor effect.
Prominent biennial variability in the boreal winter Niño3.4, spring NTA SST, summer WPSH and NPSH existed in this Atlantic–Pacific-coupled process. The red arrow represents the ‘charging' process in which the preceding winter ENSO influences the spring NTA SST like a battery charges a capacitor via an atmospheric bridge mechanism, and the blue arrow is for the ‘discharging' process in which the NTA SST exerts its climatic influences on the following ENSO like a discharging capacitor via a subtropical teleconnection mechanism.
Figure 5
Figure 5. Changes in the effectiveness of the Atlantic capacitor effect in numerical experiments with different AMO phases.
(a) The ‘charging' process represented by the correlation coefficients between the winter Niño3.4 index and the following spring NTA index in the positive-AMO run and the negative-AMO run. The dashed line denotes the 95% confidence interval. (b) The ‘discharging' process represented by the correlation coefficients between the spring NTA index and the subsequent winter Niño3.4 index. The previous winter Niño3.4 regressions had been removed from NTA index before calculating coefficient. (c) Power spectra of the winter Niño3.4 indices in CTRL, positive and negative-AMO runs. The dashed line denotes the 95% confidence interval against red noise. (d) As in c but for the spring NTA indices.

Similar articles

Cited by

References

    1. Dai A., Trenberth K. E. & Karl T. R. Global variations in droughts and wet spells: 1990–1995. Geophys. Res. Lett. 25, 3367–3370 (1998).
    1. Wang B., Xiang B. & Lee J. Y. Subtropical high predictability establishes a promising way for monsoon and tropical storm predictions. Proc. Natl Acad. Sci. USA 110, 2718–2722 (2013). - PMC - PubMed
    1. Barnard P. L. et al.. Coastal vulnerability across the Pacific dominated by El Niño/Southern Oscillation. Nat. Geosci. 8, 801–807 (2015).
    1. Rasmusson E. M., Wang X. & Ropelewski C. F. The biennial component of ENSO variability. J. Mar. Syst. 1, 71–96 (1990).
    1. Barnett T. P. The interaction of multiple time scales in the tropical climate system. J. Clim. 4, 269–285 (1991).

Publication types