. 2017 May;81(5):641-652.
doi: 10.1002/ana.24922. Epub 2017 May 4.

Deoxycytidine and Deoxythymidine Treatment for Thymidine Kinase 2 Deficiency

Affiliations

Deoxycytidine and Deoxythymidine Treatment for Thymidine Kinase 2 Deficiency

Carlos Lopez-Gomez et al. Ann Neurol. 2017 May.

Abstract

Objective: Thymidine kinase 2 (TK2), a critical enzyme in the mitochondrial pyrimidine salvage pathway, is essential for mitochondrial DNA (mtDNA) maintenance. Mutations in the nuclear gene, TK2, cause TK2 deficiency, which manifests predominantly in children as myopathy with mtDNA depletion. Molecular bypass therapy with the TK2 products, deoxycytidine monophosphate (dCMP) and deoxythymidine monophosphate (dTMP), prolongs the life span of Tk2-deficient (Tk2-/- ) mice by 2- to 3-fold. Because we observed rapid catabolism of the deoxynucleoside monophosphates to deoxythymidine (dT) and deoxycytidine (dC), we hypothesized that: (1) deoxynucleosides might be the major active agents and (2) inhibition of deoxycytidine deamination might enhance dTMP+dCMP therapy.

Methods: To test these hypotheses, we assessed two therapies in Tk2-/- mice: (1) dT+dC and (2) coadministration of the deaminase inhibitor, tetrahydrouridine (THU), with dTMP+dCMP.

Results: We observed that dC+dT delayed disease onset, prolonged life span of Tk2-deficient mice and restored mtDNA copy number as well as respiratory chain enzyme activities and levels. In contrast, dCMP+dTMP+THU therapy decreased life span of Tk2-/- animals compared to dCMP+dTMP.

Interpretation: Our studies demonstrate that deoxynucleoside substrate enhancement is a novel therapy, which may ameliorate TK2 deficiency in patients. Ann Neurol 2017;81:641-652.


Conflict of interest statement

Potential Conflict of Interest: Dr. Hirano and Columbia University Medical Center (CUMC) have filed patent applications covering the potential use of deoxynucleoside treatment for TK2 deficiency in humans. CUMC has licensed pending patent applications related to the technology to Meves Pharmaceuticals, Inc. and CUMC may be eligible to receive payments related to the development and commercialization of the technology. Any potential licensing fees earned will be paid to CUMC and are shared with Dr. Hirano through CUMC distribution policy. Dr. Hirano will serve as a paid consultant to Meves Pharmaceutical, Inc.

Figures

Figure 1
Figure 1. Survival and growth curves of the Tk2 H126N knockin mice receiving different treatments
A. Survival of Tk2 homozygous knock-in mice with the following treatments: Tk2-/-milk (N=6) vs Tk2-/-200 dCMP+dTMP+THU (N=5), p=0.0013; Tk2-/-milk vs Tk2-/-260 dC+dT (N=7), p=0.0006; Tk2-/-milk vs Tk2-/-520 dC+dT (N=11), p<0.0001; Tk2-/-260 dC+dT vs Tk2-/-520 dC+dT, p=0.0009. Tk2-/-200 dCMP+dTMP (N=5), Tk2-/-400 dCMP+dTMP (N=4), Tk2-/-400 dCMP+dTMP+THU (N=5). p-values determined by Mantel-Cox tests. B. Effects of dC+dT therapy on mouse growth. Each symbol represents mean weight at each time-point ± SEM. Tk2+untreated N=10; Tk2+ 260 dC+dT N=18; Tk2-/-260 dC+dT N=6; Tk2+ 520 dC+dT N=21; Tk2-/- 520 dC+dT N=11. C-D. Weight of wild type mice at postnatal day 60 (mean ± SD).
Figure 2
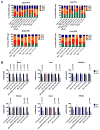
Figure 2. Effect of therapies on dNTP pools and mtDNA levels
A. Proportions of dNTPs in isolated mitochondria from brain (left) and liver (right) at postnatal days 13 (upper) and 29 (lower). Untreated Tk2+ P13 N=8; Untreated Tk2-/- P13 N=5; TK2+ 200 dCMP+dTMP P13 N= 6; Tk2-/- 200 dCMP+dTMP P13 N=5; TK2+ 400 dCMP+dTMP+THU P13 N= 5; Tk2-/- 400 dCMP+dTMP+THU P13 N=4; Tk2+260 dC+dT P13 N=5; Tk2-/-260 dC+dT P13 N=4; Tk2+520 dC+dT P13 N=7; Tk2-/-520 dC+dT N=6; Untreated Tk2+ P29 N=6; TK2+ 200 dCMP+dTMP P29 N= 7; Tk2-/- 200 dCMP+dTMP P29 N=9; Tk2+260 dC+dT P29 N=2; Tk2-/-260 dC+dT P29 N=4; Tk2+520 dC+dT P29 N=7; Tk2-/-520 dC+dT P29 N=5. B. mtDNA levels in brain, liver, intestine, muscle, kidney and heart in Tk2-/- mice. Data are represented as mean ± standard deviation (SD) of the percent of mtDNA copies relative to Tk2+. Untreated Tk2+ P13 N=10; Untreated Tk2-/- P13 N=2; Tk2+260 dC+dT P13 N=9; Tk2-/-260 dC+dT P13 N=3; Tk2+520 dC+dT P13 N=26; Tk2-/-520 dC+dT N=14; TK2+ 400 dCMP+dTMP+THU P13 N= 3; Tk2-/- 400 dCMP+dTMP+THU P13 N=4; Tk2+260 dC+dT P29 N=2; Tk2-/-260 dC+dT P29 N=4; Tk2+520 dC+dT P29 N=7; Tk2-/-520 dC+dT P29 N=5. P-values were assessed by Mann-Whitney U tests.
Figure 3
Figure 3. dT and uracil levels in brain at age 13 days and mtDNA levels in near-terminal mice under dC+dT therapy
A. dT and uracil levels in brain were measured by HPLC before and after 30 minutes of each treatment. Data are expressed as mean ± SD. Untreated Tk2-/- N=3; Tk2+ 260 dC+dT N=6; Tk2-/- 260 dC+dT N=3; Tk2-/- 200 dCMP+dTMP N=9. B. mtDNA levels are represented as mean ± SD of the percent mtDNA copies relative to aged-matched Tk2+520 dC+dT mice. Tk2+520 dC+dT N=12; Tk2-/-520 dC+dT N=6.
Figure 4
Figure 4. Activities of Respiratory Chain Enzyme (RCE) complexes I and IV normalized to citrate synthase activity and CS, RCE complexes I and IV normalized to protein concentration
Data are represented as percent of RCE activities normalized to citrate synthase activity or protein concentration in Tk2-/- mouse tissues relative to Tk2+ for each treatment. TK2+400 dCMP+dTMP+THU P13 N= 5; Tk2-/-400 dCMP+dTMP+THU P13 N=4; Tk2+260 dC+dT P13 N=8; Tk2-/-260 dC+dT P13 N=3; Tk2+260 dC+dT P29 N=2; Tk2-/-260 dC+dT P29 N=4; Tk2+520 dC+dT P29 N=7; Tk2-/-520 dC+dT P29 N=5.
Figure 5
Figure 5. Activities of Respiratory Chain Enzyme (RCE) complexes II, I+III and II+III, normalized to CS activity and to protein concentration
Data are represented as percent of RCE activities normalized to citrate synthase activity or protein concentration in Tk2-/- mouse tissues relative to Tk2+ for each treatment. TK2+400 dCMP+dTMP+THU P13 N= 5; Tk2-/-400 dCMP+dTMP+THU P13 N=4; Tk2+260 dC+dT P13 N=8; Tk2-/-260 dC+dT P13 N=3; Tk2+260 dC+dT P29 N=2; Tk2-/-260 dC+dT P29 N=4; Tk2+520 dC+dT P29 N=7; Tk2-/-520 dC+dT P29 N=5.
Figure 6
Figure 6. Effect of dC+dT therapy on respiratory chain enzyme (RCE) protein levels in brain, normalized to complex II
A. Two representative western blots showing bands for the five RCE complexes. B. RCE levels normalized to complex II, represented as percent of the RCE levels in Tk2+ mice.
Figure 7
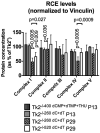
Figure 7. Effect of dC+dT and dCMP+dTMP+THU therapies on respiratory chain enzyme (RCE) protein levels in brain, normalized to Vinculin
RCE proteins (normalized to vinculin) are represented as percents of the RCE levels in Tk2+ for each treatment. TK2+ 400 dCMP+dTMP+THU P13 N= 5; Tk2-/- 400 dCMP+dTMP+THU P13 N=4; Tk2+260 dC+dT P13 N=5; Tk2-/-260 dC+dT P13 N=3; Tk2+260 dC+dT P29 N=5; Tk2-/-260 dC+dT P29 N=8; Tk2+520 dC+dT P29 N=5; Tk2-/-520 dC+dT P29 N=10.
Figure 8
Figure 8. Mitochondrial and cytosolic deoxypyrimidine metabolic pathways
Enzymes are marked in ovals. CDA, cytidine deaminase; dA, deoxyadenosine; dC, deoxycytidine; DCK, deoxycytidine kinase; dG, deoxyguanosine; DGK, deoxyguanosine kinase; dT, thymidine; dU, deoxyuridine; ENT1, equilibrative nucleoside transporter 1; nDPK, nucleoside diphosphate kinase; nMPK, nucleoside monophosphate kinase; THU, tetrahydrouridine; TK1, thymidine kinase 1; TK2, thymidine kinase 2; TS, thymidylate synthase.

References

    1. Saada A, Shaag A, Mandel H, et al. Mutant mitochondrial thymidine kinase in mitochondrial DNA depletion myopathy. Nature genetics. 2001 Nov;29(3):342–4. - PubMed
    1. Lesko N, Naess K, Wibom R, et al. Two novel mutations in thymidine kinase-2 cause early onset fatal encephalomyopathy and severe mtDNA depletion. Neuromuscular disorders : NMD. 2010 Mar;20(3):198–203. - PubMed
    1. Mancuso M, Salviati L, Sacconi S, et al. Mitochondrial DNA depletion: mutations in thymidine kinase gene with myopathy and SMA. Neurology. 2002 Oct 22;59(8):1197–202. - PubMed
    1. Behin A, Jardel C, Claeys KG, et al. Adult cases of mitochondrial DNA depletion due to TK2 defect: an expanding spectrum. Neurology. 2012 Feb 28;78(9):644–8. - PubMed
    1. Tyynismaa H, Sun R, Ahola-Erkkila S, et al. Thymidine kinase 2 mutations in autosomal recessive progressive external ophthalmoplegia with multiple mitochondrial DNA deletions. Human molecular genetics. 2012 Jan 1;21(1):66–75. - PubMed

MeSH terms