. 2017 Mar 20:6:e22767.
doi: 10.7554/eLife.22767.

A high-resolution map of transcriptional repression

Affiliations

A high-resolution map of transcriptional repression

Ziwei Liang et al. Elife. .

Abstract

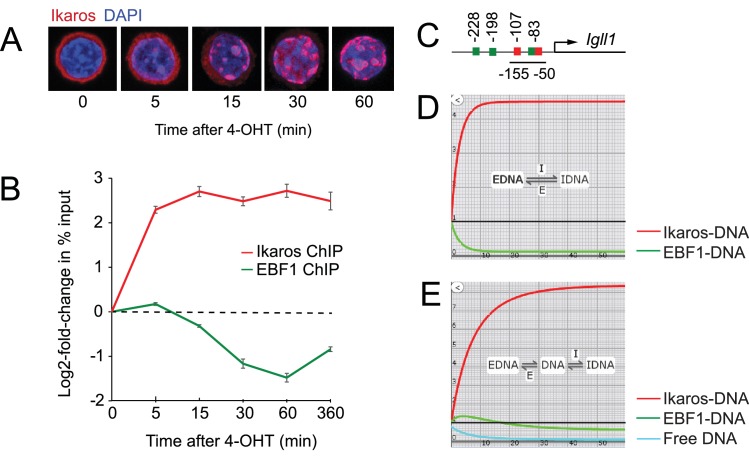
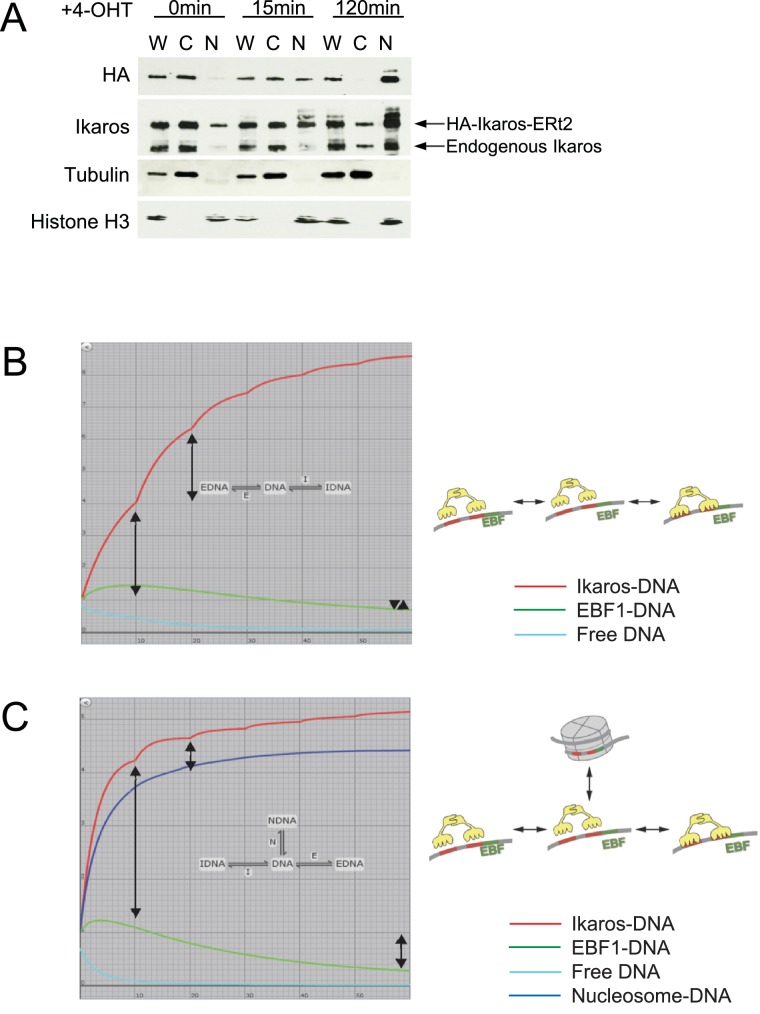
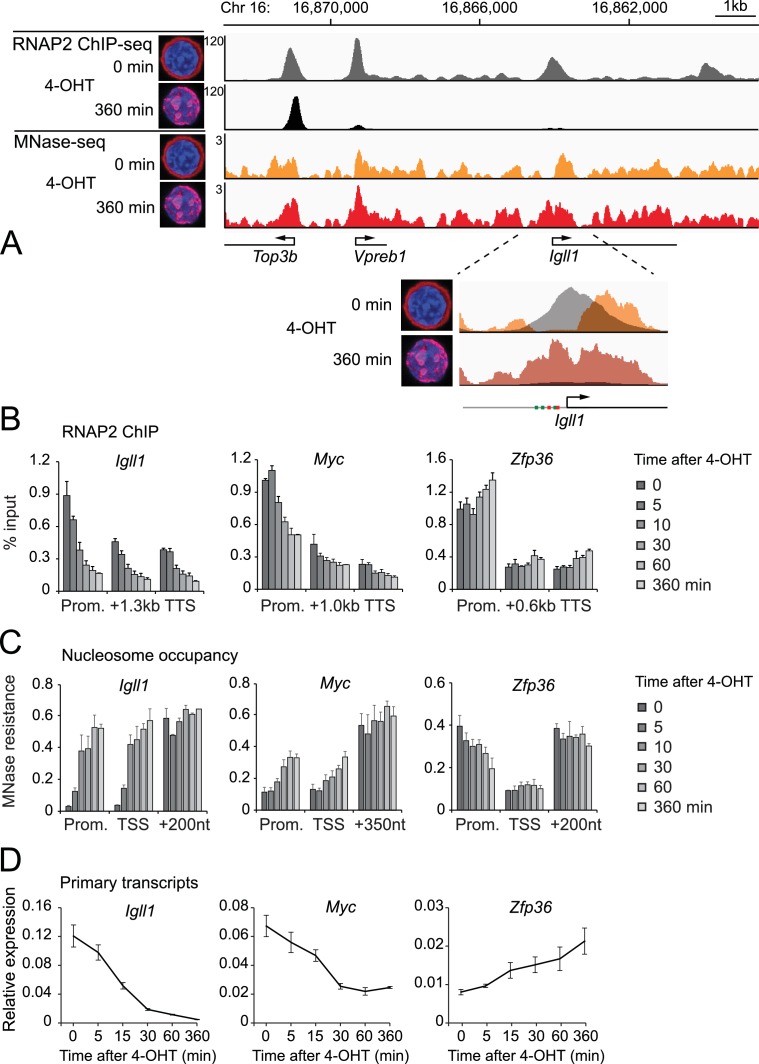
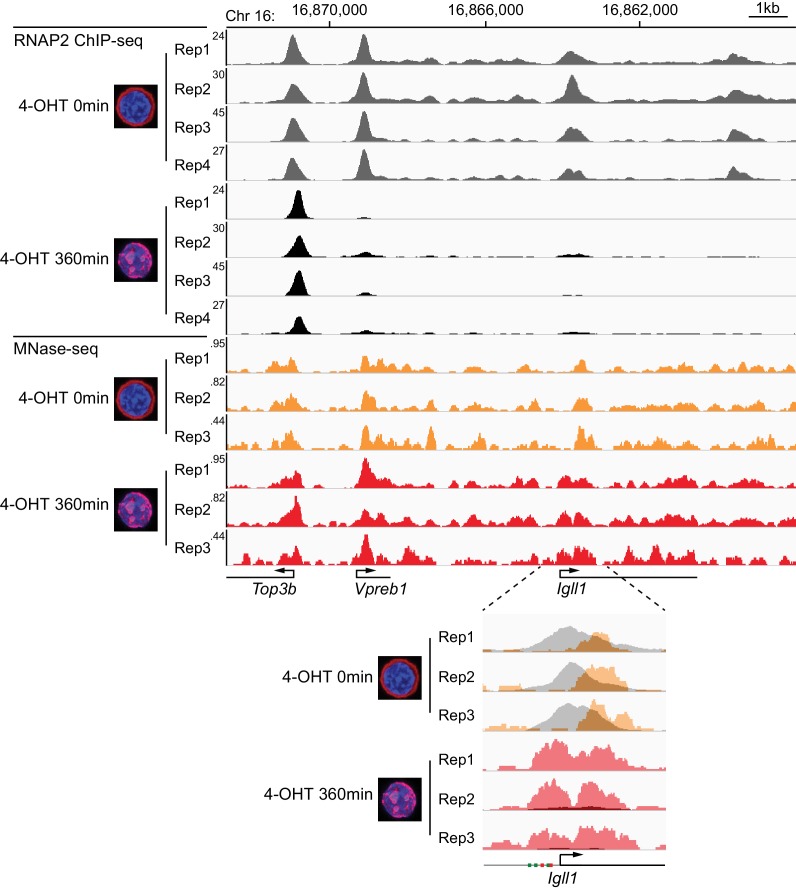
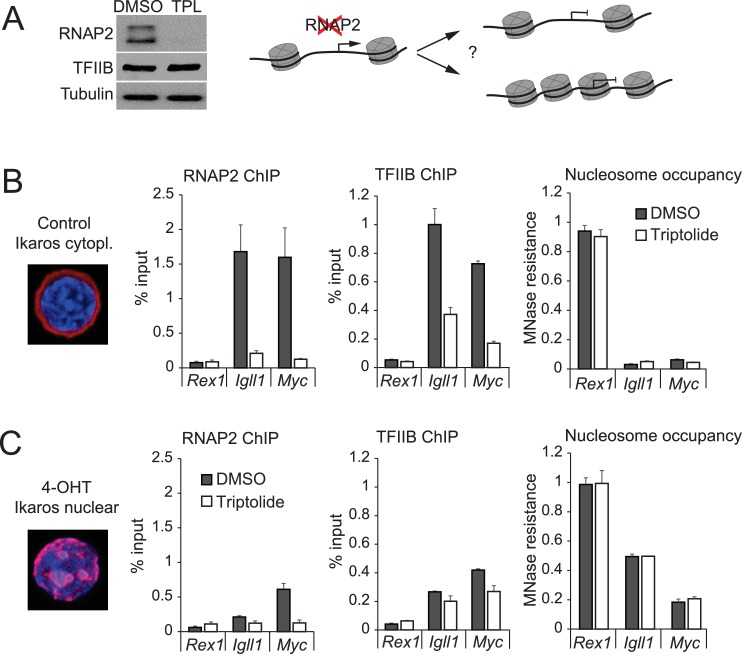
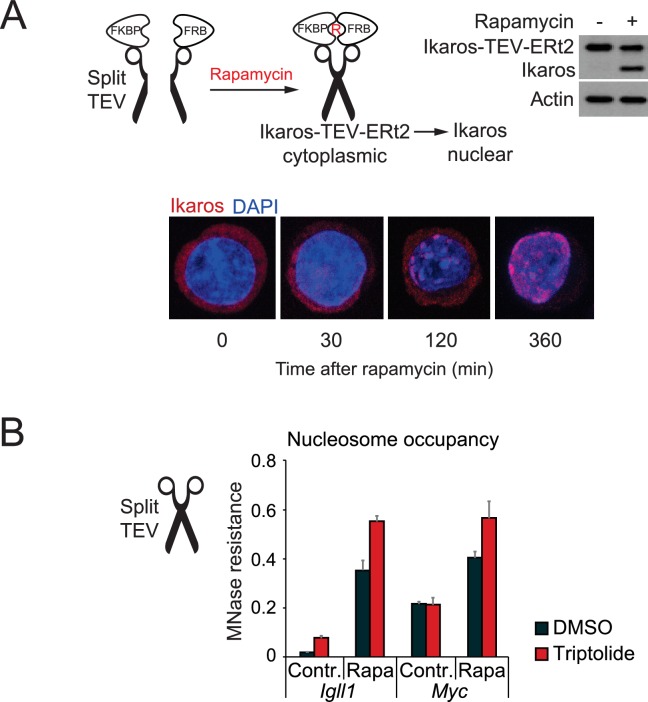
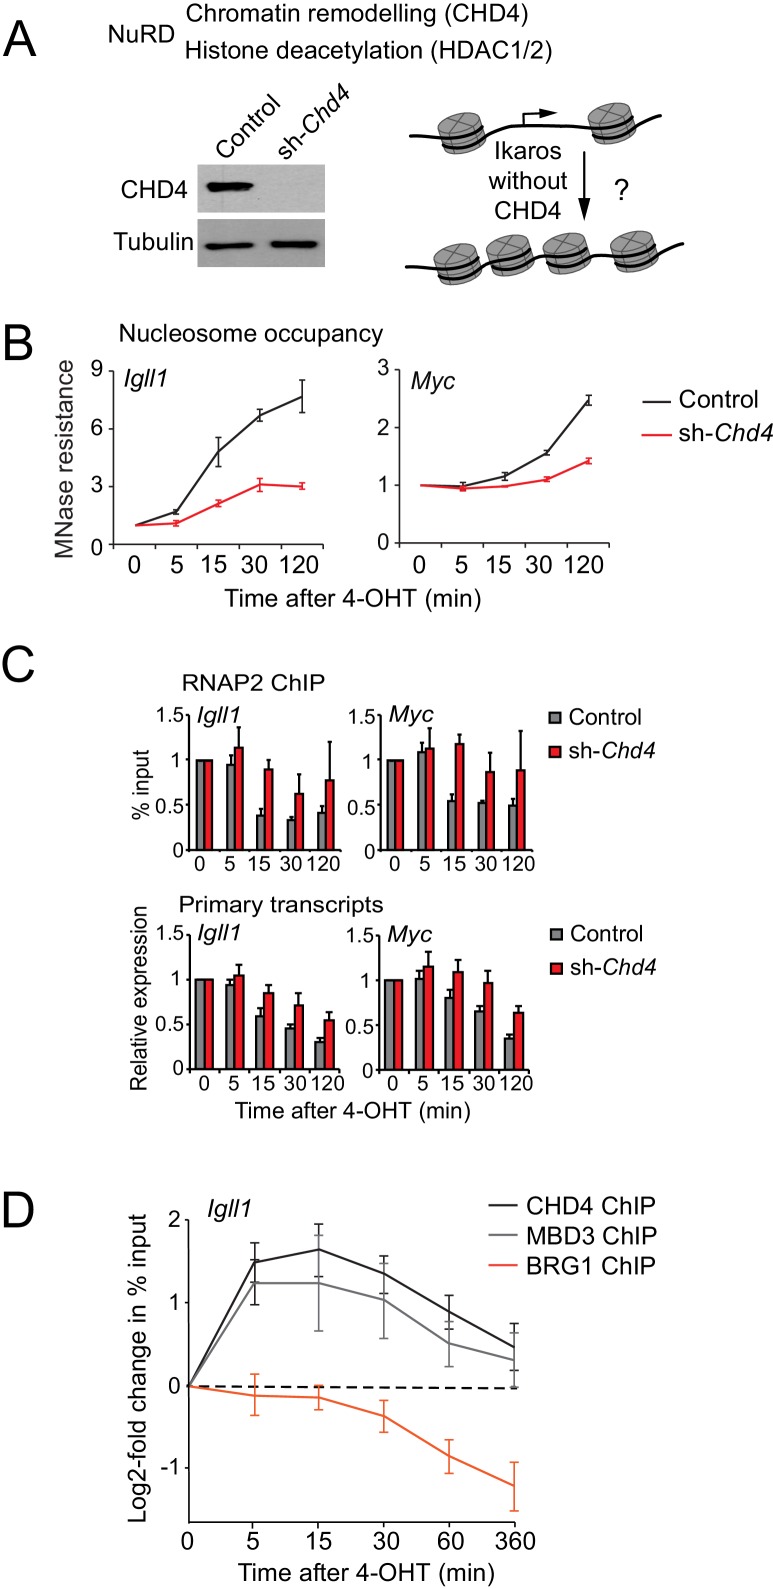
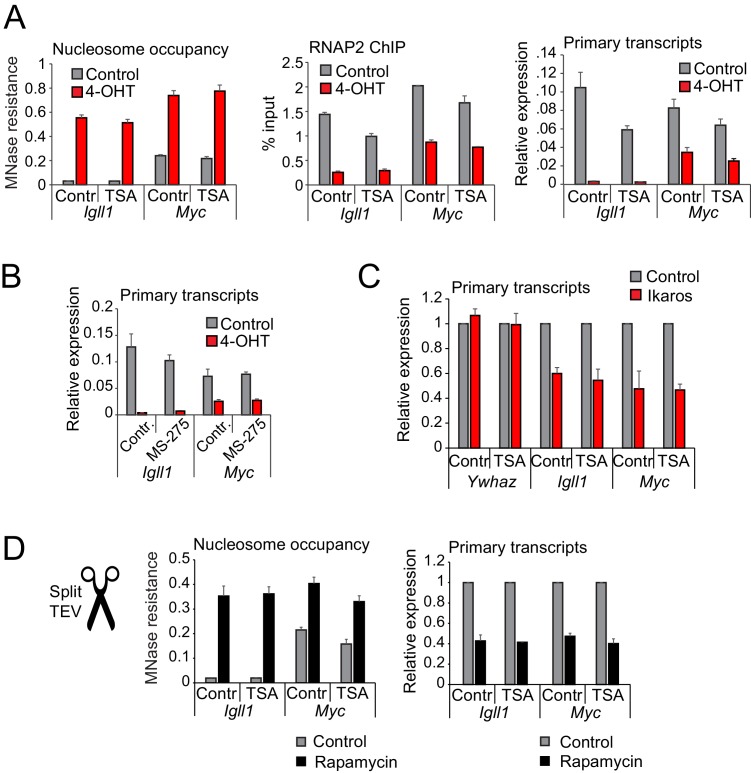
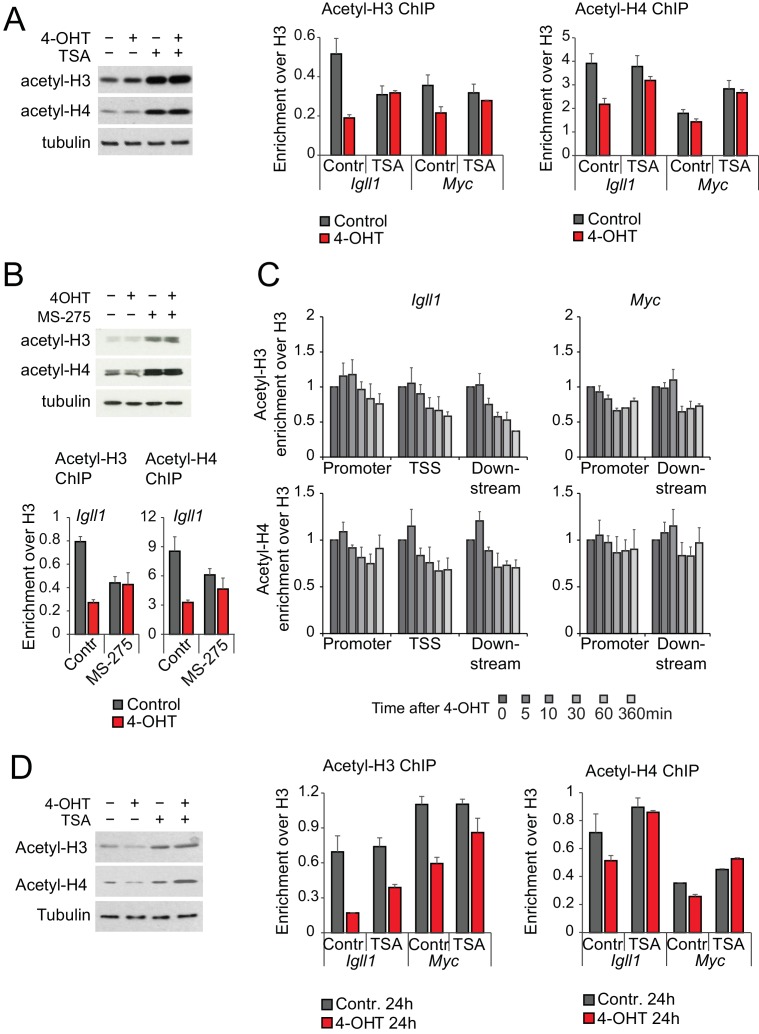
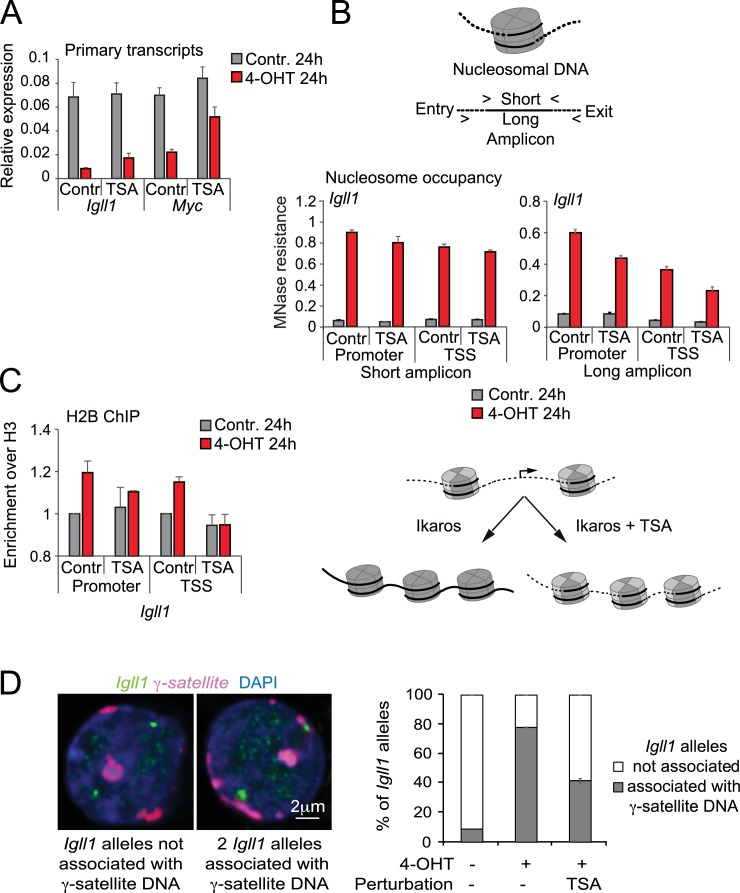
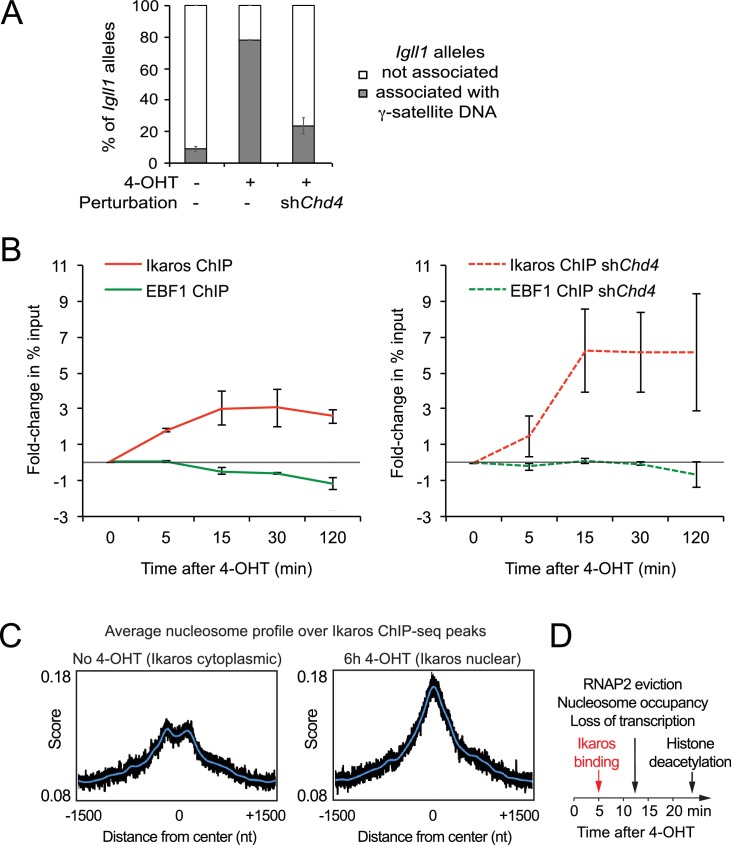
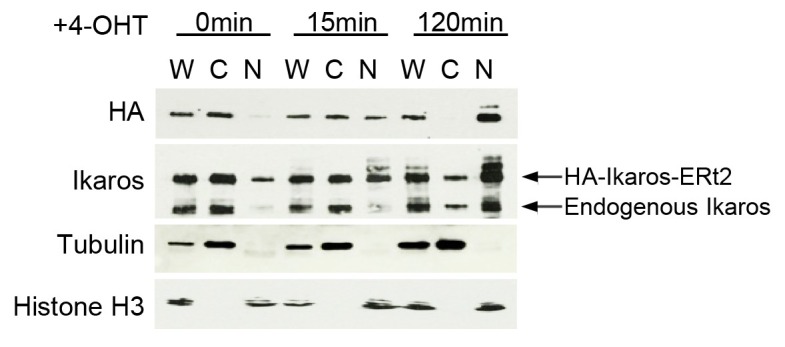
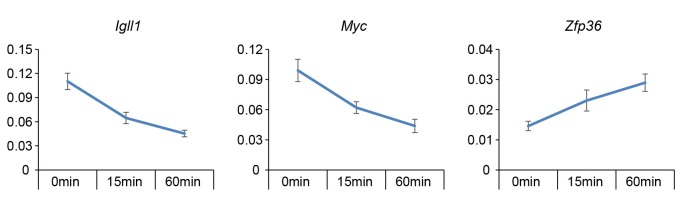
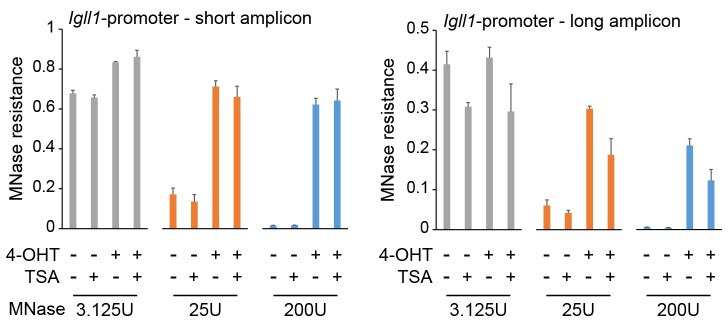
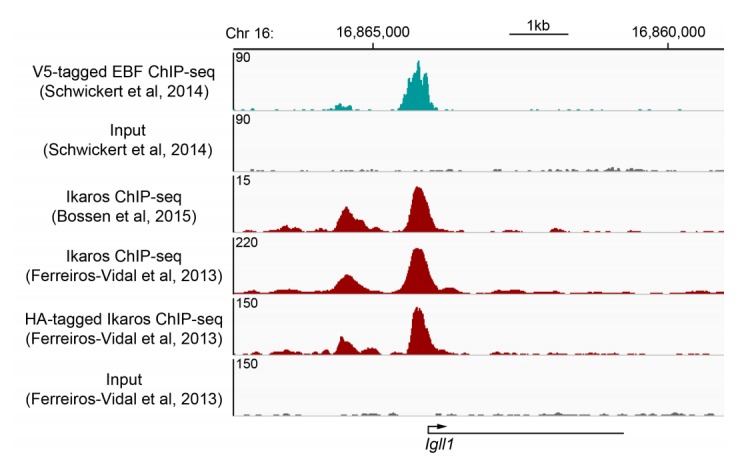
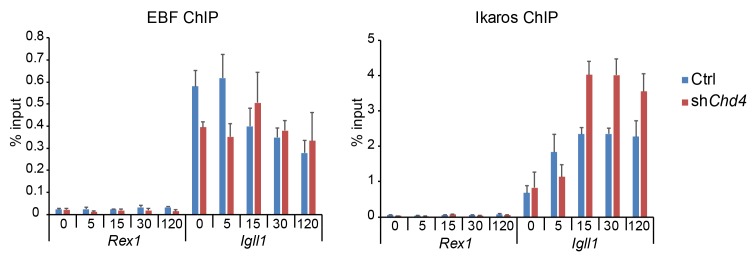
Turning genes on and off is essential for development and homeostasis, yet little is known about the sequence and causal role of chromatin state changes during the repression of active genes. This is surprising, as defective gene silencing underlies developmental abnormalities and disease. Here we delineate the sequence and functional contribution of transcriptional repression mechanisms at high temporal resolution. Inducible entry of the NuRD-interacting transcriptional regulator Ikaros into mouse pre-B cell nuclei triggered immediate binding to target gene promoters. Rapid RNAP2 eviction, transcriptional shutdown, nucleosome invasion, and reduced transcriptional activator binding required chromatin remodeling by NuRD-associated Mi2beta/CHD4, but were independent of HDAC activity. Histone deacetylation occurred after transcriptional repression. Nevertheless, HDAC activity contributed to stable gene silencing. Hence, high resolution mapping of transcriptional repression reveals complex and interdependent mechanisms that underpin rapid transitions between transcriptional states, and elucidates the temporal order, functional role and mechanistic separation of NuRD-associated enzymatic activities.

Keywords: B cell; Ikaros; chromosomes; corepressor complex; gene silencing; genes; mouse; transcriptional repression.


Conflict of interest statement

The authors declare that no competing interests exist.

Figures

Figure 1.
Figure 1.. Ikaros binding and EBF eviction have different kinetics.
(A) Time course of nuclear translocation of HA-Ikaros-ERt2 induced by 4-OHT. The fraction of nuclear Ikaros-ERt2 was estimated by immunofluorescence staining for the HA tag (red) as <5%, 20%, 50%, 80% and 95% at 0, 5, 15, 30 and 60 min after 4-OHT in 3 independent biological replicates. (B) ChIP-PCR time course of Ikaros and EBF1 binding at the Igll1 promoter after 4-OHT. ChIP was done with antisera against the Ikaros C-terminus that detect Ikaros-ERt2 as well as pre-bound endogenous Ikaros. Log2 of mean ± SE, 3 independent biological replicates. Increased binding of Ikaros was significant by 5 min (p<0.05, Students' T test). Decreased binding of EBF1 was significant by 15 min. (C) The arrangement of binding sites for Ikaros (red) and EBF1 (green) at the Igll1 promoter. (D) Two-state model with DNA binding sites occupied either by EBF1 or by Ikaros (EBF-DNA <=> Ikaros-DNA). Increase in Ikaros binding (red) comes at the expense of EBF binding (green). (E) Three-state model where a fraction of DNA binding sites is unbound at any moment in time (turquoise). DOI: http://dx.doi.org/10.7554/eLife.22767.002
Figure 1—figure supplement 1.
Figure 1—figure supplement 1.. Nuclear translocation of Ikaros and 3- versus 4-state models of Ikaros-EBF competition.
(A) Endogenous versus exogenous Ikaros abundance in the cytoplasm and the nucleus. Western blotting for exogenous Ikaros (anti-HA), total Ikaros (Ikaros C-terminal antibody), the cytoplasmic marker Tubulin and the nuclear marker histone H3 in whole cell lysate (W), cytoplasmic (C) and nuclear (N) fractions before and after 4-OHT addition. Mobility distinguishes endogenous Ikaros from the HA-Ikaros-ERt2 fusion protein. (B) Three-state model incorporating the gradual nature of the increase in nuclear Ikaros concentration predicts a steeper rise in Ikaros binding (red, arrows mark the increase in Ikaros binding during the first and second time period) until the available free DNA (turquoise) is depleted. The model also predicts little or no decrease in EBF1 binding (green) at equilibrium (arrowheads mark the impact of Ikaros translocation on EBF1 binding). (C) Introduction of an additional state where a fraction of transcription factor binding sites become inaccessible over time (blue, marked by a nucleosome in the cartoon model) capture key features of the Ikaros and EBF1 ChIP data in Figure 1B, namely diminishing increments in Ikaros binding (red, arrows mark the increase in Ikaros binding during the first and second time period) and a significant reduction in EBF1 binding at equilibrium (green, arrows mark the impact of Ikaros translocation on EBF1 binding). DOI: http://dx.doi.org/10.7554/eLife.22767.004
Figure 2.
Figure 2.. Kinetics of Ikaros-mediated changes in RNAP2 occupancy, locus accessibility and transcription.
(A) Ikaros triggers RNAP2 eviction and nucleosome recruitment at the Igll1 promoter. RNAP2 ChIP-seq: pooled data from 4 independent biological replicates. MNase-seq: pooled data from 3 independent biological replicates. Figure 2—figure supplement 1 shows the data for each individual replicate. (B) Kinetics of RNAP2 binding at Igll1, Myc, and Zfp36 after 4-OHT by ChIP-PCR. Mean ± SE, n = 3. RNAP2 binding was significantly reduced at the Igll1 promoter, gene body and TTS from 15 min and the Myc promoter from 30 min. (C) Kinetics of nucleosome occupancy at Igll1, Myc, and Zfp36 after 4-OHT by MNase-PCR of 80–120 bp amplicons. 3 independent biological replicates. Nucleosome occupancy was significantly increased at the Igll1 promoter and TSS from 5 min and the Myc promoter and TSS from 15 min. (D) Kinetics of primary Igll1, Myc, and Zfp36 transcripts after 4-OHT by RT-PCR with primer pairs designed to span an intron-exon boundary (Igll1 and Myc) or located within an intron (Zfp36). Mean ± SE, 4 independent biological replicates. Primary Igll1 and Myc transcripts were significantly reduced from 15 and 5 min, respectively. DOI: http://dx.doi.org/10.7554/eLife.22767.005
Figure 2—figure supplement 1.
Figure 2—figure supplement 1.. Reproducibility of RNAP2 ChIP-seq and MNase-seq.
The figure shows each individual replicate of the RNAP2 ChIP-seq and MNase-seq data summarised in Figure 2A. DOI: http://dx.doi.org/10.7554/eLife.22767.007
Figure 3.
Figure 3.. RNAP2 is not required for chromatin accessibility of Ikaros target promoters.
(A) Left: Western blotting for RNAP2 and TFIIB after 3 hr treatment with 1 uM triptolide (TPL). Tubulin is a loading control. 3 independent biological replicates. Right: Possible impact of RNAPII removal: promoters may remain nucleosome-free (top) or not (bottom). (B) RNAP2 ChIP-PCR, TFIIB ChIP-PCR and MNase-PCR at the indicated promoters following 4 hr of 1 μM triptolide or carrier (DMSO, grey). Mean ± SE, 3 independent biological replicates. Triptolide significantly reduced RNAP2 and TFIIB occupancy but did not significantly affect nucleosome occupancy at the Igll1 and Myc promoters. (C) As (B) with 4-OHT present during the last hour. Mean ± SE, 3 independent biological replicates. Triptolide did not significantly affect the ability of Ikaros to increase nucleosome occupancy at the Igll1 and Myc promoters. DOI: http://dx.doi.org/10.7554/eLife.22767.011
Figure 3—figure supplement 1.
Figure 3—figure supplement 1.. Nuclear translocation of Ikaros by proteolytic cleavage of Ikaros fusion proteins.
(A) Schematic representation of Ikaros translocation induced by the proteolytic cleavage of Ikaros-TEV-ERt2 by Tobacco Etch Virus (TEV) protease. Ikaros-TEV-ERt2 fusion proteins are retained in the cytompasm until cleavage. The separate N- and C-termini of TEV protease are fused to FKBP and FRB, respectively. TEV activity is restored by the addition of rapamycin (R) (Wehr et al., 2006). Cleavage separates Ikaros from ERt2. The efficiency of inducible cleavage after rapamycin (2 hr, 25 nM) is monitored by western blotting using Ikaros antibodies (right). Actin was used as loading control. Representative of 3 independent biological replicates. (B) MNase digestion followed by PCR was used to determine changes in the accessibility of the Igll1 and Myc promoters after triptolide-induced removal of RNAP2. The experiment complements the data shown in Figure 3B and C, but Split-TEV was used instead of 4-OHT-induced nuclear translocation of Ikaros. Split-TEV was activated by the addition of rapamycin at 25 nM for 2 hr. Mean ± SE, 3 independent biological replicates. Ikaros induction and tripolide-mediated RNAP2 depletion may synergise in increasing the nucleosome occupancy of the Igll1 promoter. DOI: http://dx.doi.org/10.7554/eLife.22767.013
Figure 4.
Figure 4.. Ikaros controls promoter accessibility through NuRD-associated chromatin remodeling.
(A) Left: CHD4 expression in control and Chd4 shRNA cells by western blotting. Tubulin is a loading control. One of 5 independent biological replicates. Right: Experimental outline. (B) MNase-PCR at the Igll1 and Myc promoters in control (black) or Chd4 shRNA cells (red) at the indicated times after 4-OHT. Mean ± SE, 3 independent biological replicates. Chd4 shRNA significantly reduced the Ikaros-induced increase in nucleosome occupancy at 15, 30 and 120 min at the Igll1 promoter and at 30 and 120 min at the Myc promoter. (C) RNAP2 ChIP-PCR (top) and MNase-PCR (bottom) at the Igll1 and Myc promoters after 4-OHT in control (black) or Chd4 shRNA cells (red). Mean ± SE, 3 independent biological replicates. RNAP2 binding was significantly reduced in control cells but not in Chd4 shRNA-treated cells from 5 to 120 min after 4-OHT at the Igll1 and the Myc promoter. Primary transcripts were significantly reduced in control but not in Chd4 shRNA-treated cells at 15 and 30 min for Igll1 and at 30 and 120 min for Myc. (D) ChIP-PCR for CHD4 (black), MBD3 (grey) and BRG1 (orange) at the Igll1 promoters at the indicated times after 4-OHT. Mean ± SE, 5 independent biological replicates for CHD4 and BRG1, 3 independent biological replicates for MBD3. CHD4 and MBD3 binding at the Igll1 promoter were significantly increased from 5 to 60 min. BRG1 binding was significantly decreased from 30 to 120 min. DOI: http://dx.doi.org/10.7554/eLife.22767.015
Figure 5.
Figure 5.. Histone deacetylase activity is dispensable for initiating transcriptional repression.
(A) MNase-PCR (left), RNAP2 ChIP-PCR (middle) and RT-PCR (right). Where indicated B3 cells were treated for 1 hr with 1 ng/ml TSA and/or 4-OHT. Figure 5—figure supplement 1A shows TSA effects on histone acetylation. Mean ± SE, 3 independent biological replicates. TSA did not significantly affect Ikaros-induced changes in nucleosome occupancy and RNAP2 binding to the Igll1 and Myc promoter, or Igll1 primary transcripts. (B) RT-PCR for primary Igll1 and Myc transcripts in control or MS-275-treated cells (1 hr, 10 uM) before (grey) and 1 hr after 4-OHT (red). Mean ± SE, 3 independent biological replicates. Figure 5—figure supplement 1B shows effects of MS-275 on histone acetylation. MS-275 treatment weakly affected Ikaros-induced changes in Igll1 primary transcripts and did not significantly affect Ikaros-induced changes in Myc primary transcripts. (C) RT-PCR for Igll1, Myc and the housekeeping gene Ywhaz in primary pre-B cells transduced with control (IRES-GFP) or Ikaros (Ikaros-IRES-GFP). Where indicated cells were treated with 1 ng/ml TSA. Mean ± SE, 3 independent biological replicates. Figure 5—figure supplement 1D shows TSA effects on histone acetylation. TSA did not significantly affect Ikaros-induced changes in Igll1 and Myc primary transcripts. (D) MNase-PCR (left) and RT-PCR (right) at Igll1 and Myc in control or TSA-treated cells (2 hr, 1 ng/ml) before (grey) and 2 hr after TEV cleavage-induced nuclear translocation of Ikaros (black). Mean ± SE, 3 independent biological replicates. DOI: http://dx.doi.org/10.7554/eLife.22767.018
Figure 5—figure supplement 1.
Figure 5—figure supplement 1.. Changes in global and local histone acetylation in response to HDAC inhibitors and Ikaros.
(A) The HDAC inhibitor TSA increases global (left) and local (right) acetylation of histones H3 and H4 at concentrations that do not interfere with the initiation of Ikaros-mediated gene silencing (1 ng/ml, see Figure 5A), 3 independent biological replicates. (B) The HDAC1/2-specific inhibitor MS-275 increases global (top) and local (bottom) acetylation of histones H3 and H4 at concentrations that do not interfere with the transcriptional downregulation of Ikaros target genes (see Figure 5B), 3 independent biological replicates. (C) ChIP-PCR was used to monitor Ikaros-induced changes in H3 and H4 acetylation. Mean ± SE, 3 independent biological replicates. (D) Prolonged treatment with 1 ng/ml of TSA over 24 hr increases global (left) and local (right) acetylation of histones H3 and H4 at Igll1 and Myc, 3 independent biological replicates. DOI: http://dx.doi.org/10.7554/eLife.22767.020
Figure 6.
Figure 6.. Histone deacetylation contributes to stable gene silencing.
(A) RT-PCR showed that 1 ng/ml TSA for 24 hr significantly relieved Ikaros-induced reduced repression of Igll and Myc primary transcripts. Mean ± SE, 3 independent biological replicates. (B) MNase PCR showed that 1 ng/ml TSA for 24 hr did not significantly affect protection of 80–120 bp amplicons (short, left) but significantly reduced protection of 130–140 bp amplicons (long, right) at the Igll1 promoter. Mean ± SE, 3 independent biological replicates. (C) ChIP-PCR to assess Ikaros-induced recruitment of histone H2B to the Igll1 promoter between control cells and cells treated with 1 ng/ml TSA for 24 hr. Enrichment was normalised to total H3. Mean ± SE, 3 independent biological replicates. TSA significantly blunted the Ikaros-induced increase the H2B/H3 ratio at the Igll1 promoter and TSS. (D) 3D DNA-FISH to monitor the position of Igll1 alleles (green) relative to γ-satellite DNA (red, blue is DAPI). The percentage of Igll1 alleles associated with γ-satellite DNA is shown as mean ± SE. Where indicated, cells were treated over night with TSA (1 ng/ml) and/or 4-OHT. At least 300 Igll1 alleles were scored for each experimental condition across 3 independent biological replicates. The impact of TSA was statistically significant across replicates (p=9.54 × 10-18 GLM binomial logit). DOI: http://dx.doi.org/10.7554/eLife.22767.021
Figure 7.
Figure 7.. Interdependence of silencing mechanisms leveraged by Ikaros.
(A) 3D DNA-FISH to monitor the position of Igll1 alleles (green) relative to γ-satellite DNA (red, blue is DAPI). The percentage of Igll1 alleles associated with γ-satellite DNA is shown as mean ± SE. Where indicated, control or shChd4 cells were treated over night with 4-OHT. At least 300 Igll1 alleles were scored for each experimental condition across 3 independent biological replicates. The impact of Chd4 knockdown was statistically significant across replicates (p=5.54×10-38 GLM binomial logit). (B) ChIP kinetics of Ikaros and EBF binding to the Igll1 promoter in control (left) and shChd4 cells (right). Increased binding of Ikaros to the Igll1 promoter was significant for both control and shChd4 cells, decreased binding of EBF1 was significant in control, but not in shChd4 cells. Mean ± SE, 3 independent biological replicates. Ikaros and EBF1 binding at 15, 30 and 120 min were significantly higher in shChd4 than control cells. (C) MNase-seq data from 3 independent biological replicates were integrated with Ikaros ChIP-seq data to show nucleosome occupancy at Ikaros binding peaks before and 6 hr after nuclear translocation of Ikaros. (D) Dynamics of Ikaros binding, RNAP2 eviction, loss of primary transcripts, nucleosome invasion, and histone deacetylation. DOI: http://dx.doi.org/10.7554/eLife.22767.023
Author response image 1.
Author response image 1.. Reproducibility of MNase-seq.
Correlation values between MNase-seq replicates and experimental groups at the indicated loci, 3 independent biological replicates for control cells and 3 independent biological replicates for IKAROS-induced cells (left). Base-pair level correlation for MNase sensitivity at the Igll1 promoter (right). DOI: http://dx.doi.org/10.7554/eLife.22767.025
Author response image 2.
Author response image 2.. Endogenous versus exogenous Ikaros expression.
Western blotting for exogenous Ikaros (anti-HA), total Ikaros (Ikaros C-terminal antibody), the cytoplasmic marker Tubulin and the nuclear marker histone H3 in whole cell lysate (W), cytoplasmic (C) and nuclear (N) fractions before and after 4-OHT addition. Mobility distinguishes endogenous Ikaros from the HA-Ikaros-ERt2 fusion protein. DOI: http://dx.doi.org/10.7554/eLife.22767.026
Author response image 3.
Author response image 3.. Transcriptional regulation by Ikaros-ERt2 in the absence of endogenous Ikaros.
B3 cells with disrupted endogenous Ikzf1 alleles were transduced with Ikaors-ERt2. Primary transcripts for Igll1, Myc, and Zfp36 were measured at the indicated times after 4-OHT addition. Mean DOI: http://dx.doi.org/10.7554/eLife.22767.027
Author response image 4.
Author response image 4.. Titration experiments confirm the impact of HDAC inhibition on MNase protection of Igll1 promoter chromatin.
MNase titration followed by quantitative PCR showed that 1ng/ml TSA for 24 hours did not significantly affect protection of 80-120 bp amplicons (short, left) but significantly reduced protection of 130-140 bp amplicons (long, right) at the Igll1 promoter. Mean ± SE of 3 independent biological replicates. DOI: http://dx.doi.org/10.7554/eLife.22767.028
Author response image 5.
Author response image 5.. Additional support for Ikaros and EBF1 binding at the Igll1 promoter in B cell progenitors.
V5 epitope tag-specific EBF1 ChIP and input (top, Schwickert et al., 2014), ChIP for endogenous Ikaros using the C-terminal Ikaros antibody employed in this study (Bossen et al., 2015; Ferreiros-Vidal et al., 2013), HA-tagged Ikaros using a HA epitope tag-specific reagent (Ferreiros-Vidal et al., 2013) and input (Ferreiros-Vidal et al., 2013) show binding of EBF1 and Ikaros to the Igll1 promoter. DOI: http://dx.doi.org/10.7554/eLife.22767.029
Author response image 6.
Author response image 6.. EBF1 and Ikaros ChIP at Igll1 compared to the control locus Rex1.
The data shown are for B cells transduced with Ikaros-IRES-Cherry and represent the mean ± SE of 3 independent biological replicates. The data have been added to the source data file for Figure 7B of the revised manuscript. DOI: http://dx.doi.org/10.7554/eLife.22767.030

References

    1. Ballaré C, Castellano G, Gaveglia L, Althammer S, González-Vallinas J, Eyras E, Le Dily F, Zaurin R, Soronellas D, Vicent GP, Beato M. Nucleosome-driven transcription factor binding and gene regulation. Molecular Cell. 2013;49:67–79. doi: 10.1016/j.molcel.2012.10.019. - DOI - PubMed
    1. Bickmore WA. The spatial organization of the human genome. Annual Review of Genomics and Human Genetics. 2013;14:67–84. doi: 10.1146/annurev-genom-091212-153515. - DOI - PubMed
    1. Bossen C, Murre CS, Chang AN, Mansson R, Rodewald HR, Murre C. The chromatin remodeler Brg1 activates enhancer repertoires to establish B cell identity and modulate cell growth. Nature Immunology. 2015;16:775–784. doi: 10.1038/ni.3170. - DOI - PMC - PubMed
    1. Brockdorff N, Turner BM. Dosage compensation in mammals. Cold Spring Harbor Perspectives in Biology. 2015;7:a019406. doi: 10.1101/cshperspect.a019406. - DOI - PMC - PubMed
    1. Brookes E, de Santiago I, Hebenstreit D, Morris KJ, Carroll T, Xie SQ, Stock JK, Heidemann M, Eick D, Nozaki N, Kimura H, Ragoussis J, Teichmann SA, Pombo A. Polycomb associates genome-wide with a specific RNA polymerase II variant, and regulates metabolic genes in ESCs. Cell Stem Cell. 2012;10:157–170. doi: 10.1016/j.stem.2011.12.017. - DOI - PMC - PubMed

Publication types