Comparative Study
. 2017 Jul;92(1):179-191.
doi: 10.1016/j.kint.2017.01.017. Epub 2017 Mar 17.

Machine-learning algorithms define pathogen-specific local immune fingerprints in peritoneal dialysis patients with bacterial infections

Affiliations
Comparative Study

Machine-learning algorithms define pathogen-specific local immune fingerprints in peritoneal dialysis patients with bacterial infections

Jingjing Zhang et al. Kidney Int. 2017 Jul.

Abstract

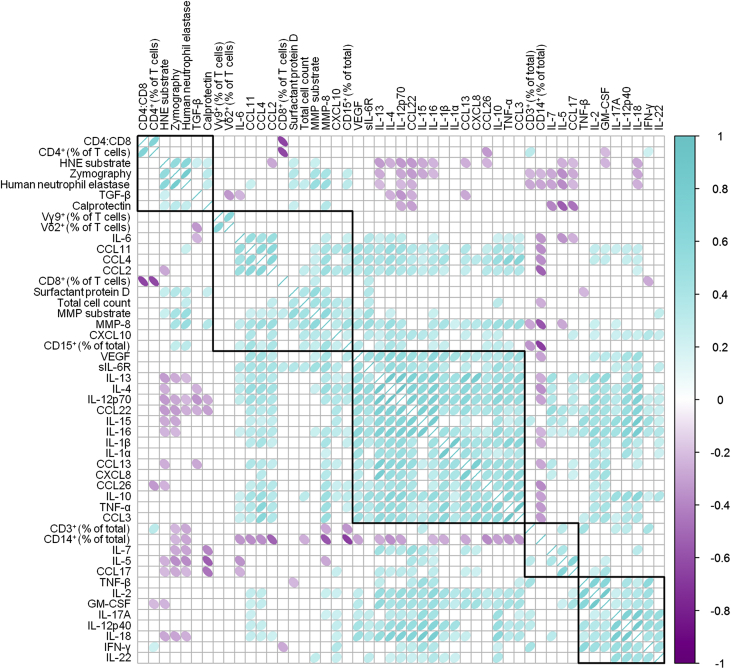
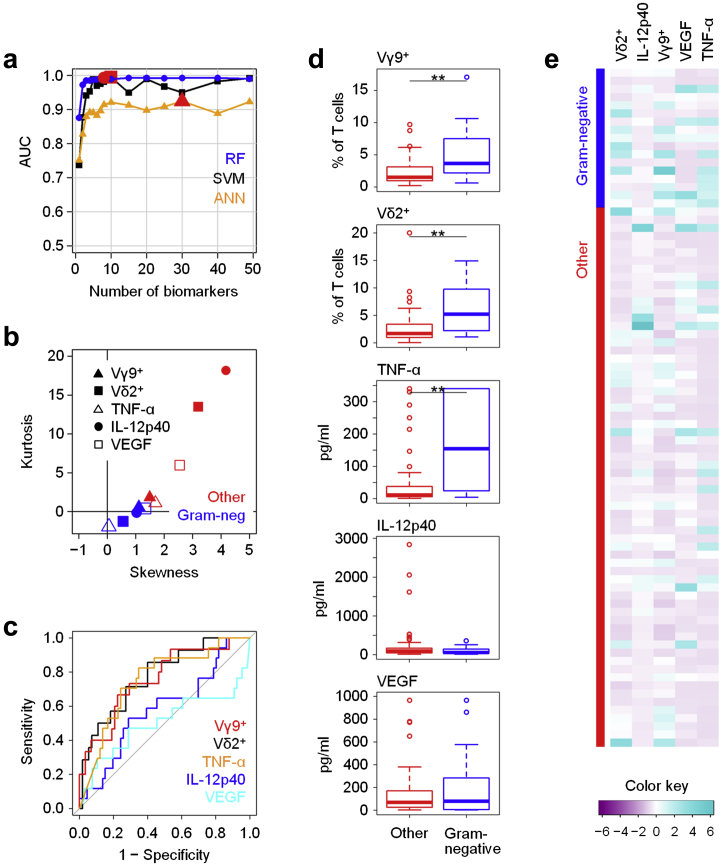
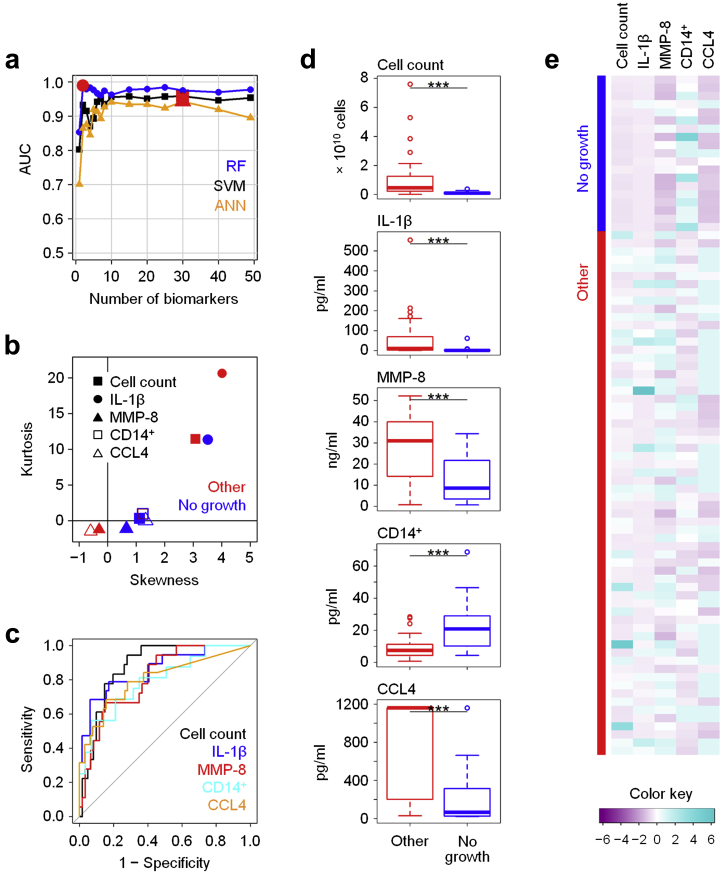
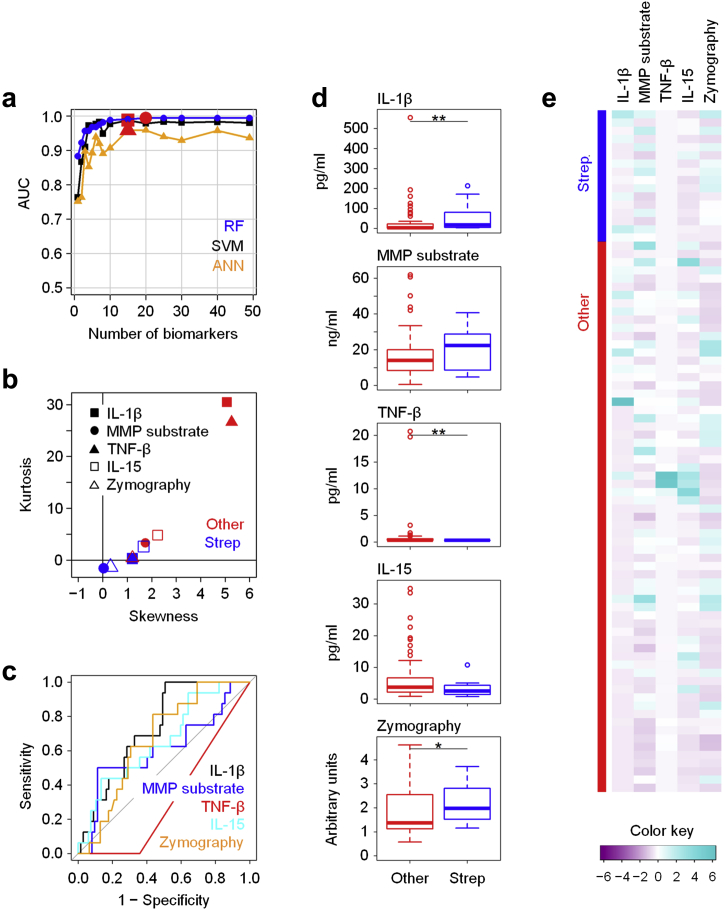
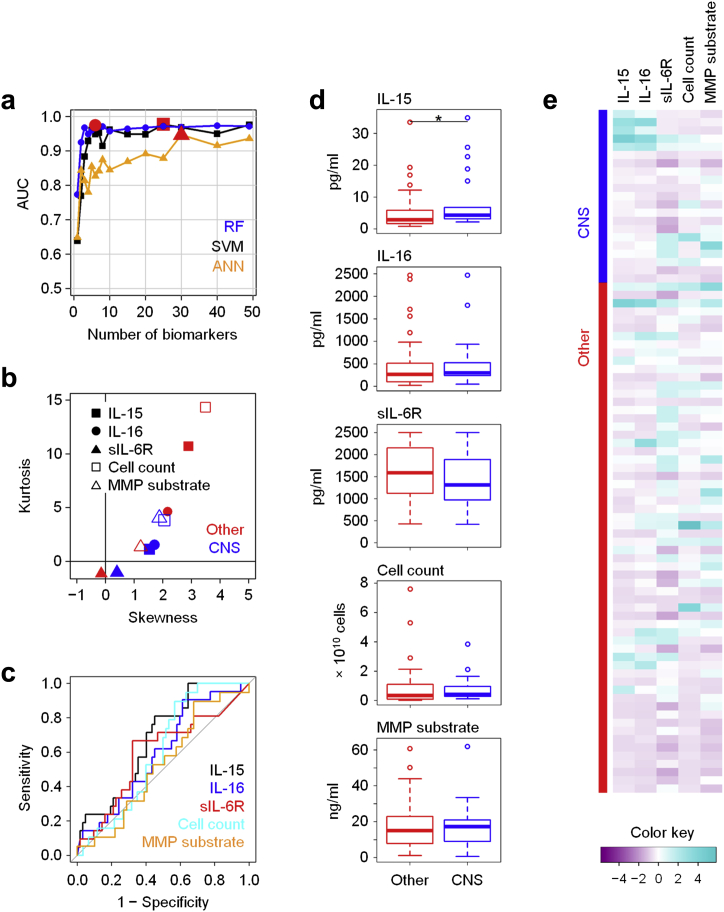
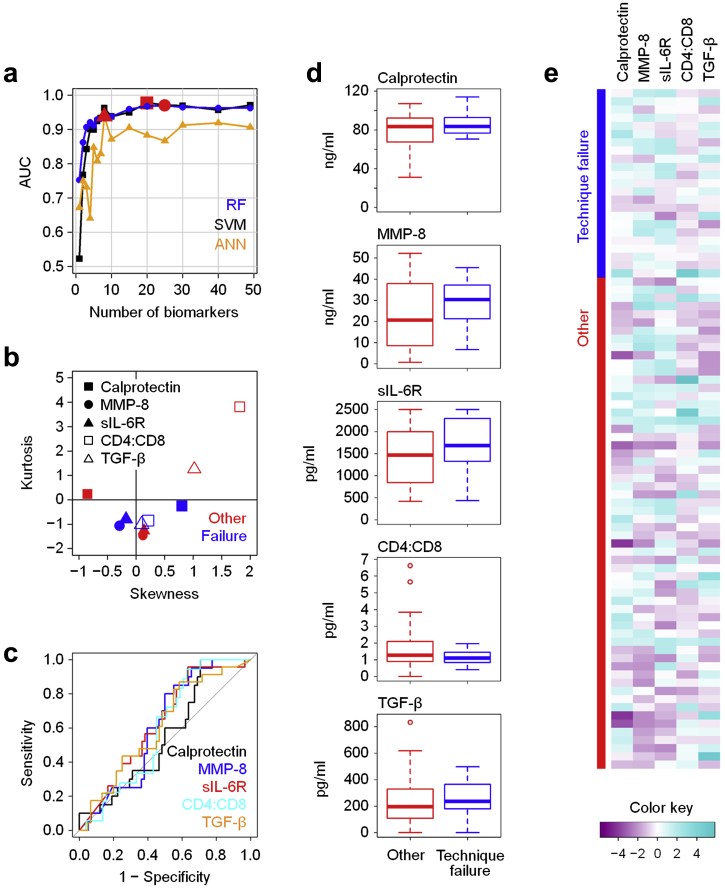
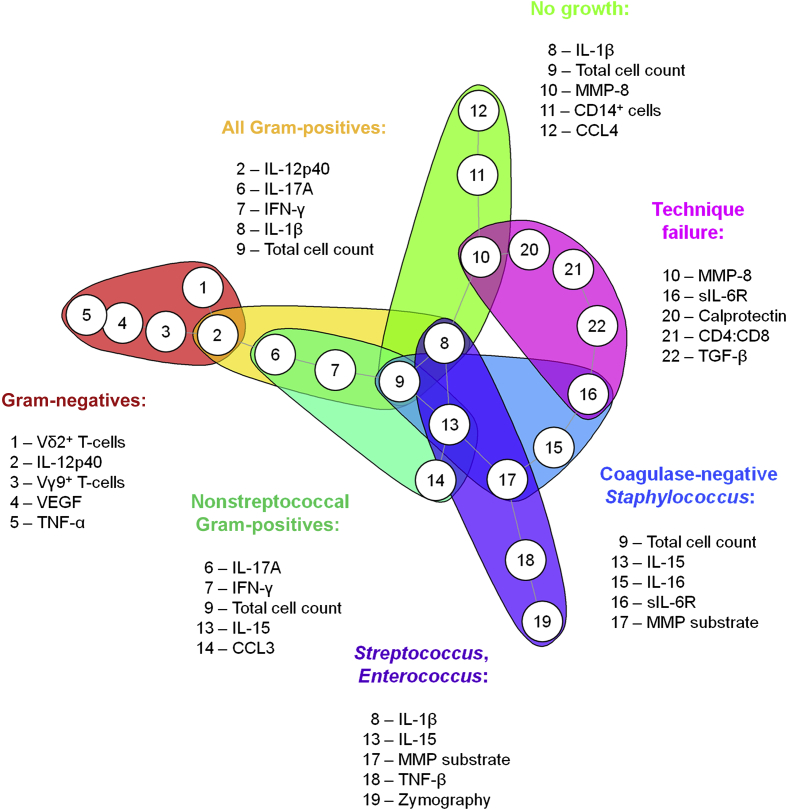
The immune system has evolved to sense invading pathogens, control infection, and restore tissue integrity. Despite symptomatic variability in patients, unequivocal evidence that an individual's immune system distinguishes between different organisms and mounts an appropriate response is lacking. We here used a systematic approach to characterize responses to microbiologically well-defined infection in a total of 83 peritoneal dialysis patients on the day of presentation with acute peritonitis. A broad range of cellular and soluble parameters was determined in peritoneal effluents, covering the majority of local immune cells, inflammatory and regulatory cytokines and chemokines as well as tissue damage-related factors. Our analyses, utilizing machine-learning algorithms, demonstrate that different groups of bacteria induce qualitatively distinct local immune fingerprints, with specific biomarker signatures associated with Gram-negative and Gram-positive organisms, and with culture-negative episodes of unclear etiology. Even more, within the Gram-positive group, unique immune biomarker combinations identified streptococcal and non-streptococcal species including coagulase-negative Staphylococcus spp. These findings have diagnostic and prognostic implications by informing patient management and treatment choice at the point of care. Thus, our data establish the power of non-linear mathematical models to analyze complex biomedical datasets and highlight key pathways involved in pathogen-specific immune responses.

Keywords: biomarkers; inflammation; machine learning methods; microbial infection; peritoneal dialysis.


Figures

Figure 1
Figure 1
Correlation analysis of local biomarkers in a total of 83 peritoneal dialysis patients on the day of presentation with acute peritonitis. Ellipses depict the correlation coefficients for each pair of biomarkers in the corresponding cell of the matrix, with the direction of the dip and the color of the shading representing positive and negative correlations, respectively. Only pairs with significant correlations (P < 0.05) are shown. Analyses were performed using the corrplot R and Hmisc R packages. GM-CSF, granulocyte macrophage colony-stimulating factor; HNE, human neutrophil elastase; IFN-γ, interferon-γ; IL, interleukin; MMP, matrix metalloproteinase; sIL-6R, soluble IL-6 receptor; TGF-β, transforming growth factor-β; TNF-α, tumor necrosis factor-α; VEGF, vascular endothelial growth factor.
Figure 2
Figure 2
Identification of local immune fingerprints associated with peritonitis caused by Gram-negative bacteria. (a) Performance of recursive feature elimination models based on Random Forest (RF), Support Vector Machines (SVM), and artificial neural networks (ANN) for the prediction of Gram-negative infections (N = 17) against all other episodes of peritonitis (N = 66), shown as area under the receiver operating characteristic curve (AUC) depending on the number of biomarkers. Red symbols depict the maximum AUC achieved for each model. (b) Kurtosis and skewness of the top 5 biomarkers selected by RF-based feature elimination. (c) Receiver operating characteristic analysis showing specificity and sensitivity of the top 5 biomarkers. (d) Tukey plots of the top 5 biomarkers in patients with confirmed Gram-negative infections and with all other episodes of peritonitis, as assessed by Mann-Whitney tests (**P < 0.01). (e) Heat map showing the top 5 biomarkers across all patients presenting with acute peritonitis. IL, interleukin; TNF-α, tumor necrosis factor-α; VEGF, vascular endothelial growth factor.
Figure 3
Figure 3
Local immune fingerprints in culture-negative episodes of peritonitis. (a) Performance of Random Forest (RF), Support Vector Machine (SVM), and artificial neural network (ANN)–based feature elimination models for the prediction of culture-negative episodes (no growth, N = 19) against microbiologically confirmed infections (other, N = 64), shown as area under the curve (AUC) depending on the number of biomarkers. Red symbols depict the maximum AUC for each model. (b) Kurtosis and skewness of the top 5 biomarkers selected by RF-based feature elimination. (c) Receiver operating characteristic analysis showing specificity and sensitivity of the top 5 biomarkers. (d) Tukey plots of the top 5 biomarkers in patients with culture-negative peritonitis and with infectious (other) episodes of peritonitis, as assessed by Mann-Whitney tests (***P < 0.001). (e) Heat map showing the top 5 biomarkers across all patients presenting with acute peritonitis. IL, interleukin; MMP, matrix metalloproteinase.
Figure 4
Figure 4
Local immune fingerprints in streptococcal (Strep) infections. (a) Performance of Random Forest (RF), Support Vector Machine (SVM), and artificial neural network (ANN)–based feature elimination models for the prediction of infections caused by streptococcal species (Streptococcus spp. and Enterococcus spp., N = 16) against all other episodes of peritonitis (N = 67), shown as area under the curve (AUC) depending on the number of biomarkers. One episode of peritonitis classified as streptococcal infection was a coinfection caused by Enterococcus sp. with light growth of coagulase-negative Staphylococcus spp. Red symbols depict the maximum AUC for each model. (b) Kurtosis and skewness of the top 5 biomarkers selected by RF-based feature elimination. (c) Receiver operating characteristic analysis showing specificity and sensitivity of the top 5 biomarkers. (d) Tukey plots of the top 5 biomarkers in patients with confirmed streptococcal infections and with all other episodes of peritonitis, as assessed by Mann-Whitney tests (*P < 0.05; **P < 0.01). (e) Heat map showing the top 5 biomarkers across all patients presenting with acute peritonitis. IL, interleukin; MMP, matrix metalloproteinase; TNF-β, tumor necrosis factor-β.
Figure 5
Figure 5
Local immune fingerprints in coagulase-negative Staphylococcus (CNS) infections. (a) Performance of Random Forest (RF), Support Vector Machine (SVM), and artificial neural network (ANN)–based feature elimination models for the prediction of infections caused by CNS (Staphylococcus epidermidis and related species; N = 21) against all other episodes of peritonitis (N = 62), shown as area under the curve (AUC) depending on the number of biomarkers. Red symbols depict the maximum AUC for each model. (b) Kurtosis and skewness of the top 5 biomarkers selected by RF-based feature elimination. (c) Receiver operating characteristic analysis showing specificity and sensitivity of the top 5 biomarkers. (d) Tukey plots of the top 5 biomarkers in patients with confirmed CNS infections and with all other episodes of peritonitis, as assessed by Mann-Whitney tests (*P < 0.05). (e) Heat map showing the top 5 biomarkers across all patients presenting with acute peritonitis. IL, interleukin; MMP, matrix metalloproteinase; sIL-6R, soluble IL-6 receptor.
Figure 6
Figure 6
Local immune fingerprints associated with poor clinical outcomes. (a) Performance of Random Forest (RF), Support Vector Machine (SVM), and artificial neural network (ANN)–based feature elimination models for the prediction of technique failure over the next 90 days (catheter removal, transfer to hemodialysis, or peritonitis-related death; N = 23) against all other episodes of peritonitis (N = 60), shown as area under the curve (AUC) depending on the number of biomarkers. Red symbols depict the maximum AUC for each model. (b) Kurtosis and skewness of the top 5 biomarkers selected by RF-based feature elimination. (c) Receiver operating characteristic analysis showing specificity and sensitivity of the top 5 biomarkers. (d) Tukey plots of the top 5 biomarkers in patients with subsequent technique failure and all other patients, as assessed by Mann-Whitney tests. (e) Heat map showing the top 5 biomarkers across all patients presenting with acute peritonitis. MMP, matrix metalloproteinase; sIL-6R, soluble IL-6 receptor; TGF-β, transforming growth factor-β.
Figure 7
Figure 7
Summary of disease-specific immune fingerprints in patients presenting with acute peritonitis. Shown are the top 5 biomarkers associated with the type of causative organism as indicated or with the risk of technique failure over the next 90 days. IFN-γ, interferon-γ; IL, interleukin; MMP, matrix metalloproteinase; sIL-6R, soluble IL-6 receptor; TGF-β, transforming growth factor-β; TNF-α, tumor necrosis factor-α; VEGF, vascular endothelial growth factor.

Comment in

References

    1. Janeway C.A., Jr. Approaching the asymptote? Evolution and revolution in immunology. Cold Spring Harb Symp Quant Biol. 1989;541:1–13. - PubMed
    1. Matzinger P. The danger model: a renewed sense of self. Science. 2002;296:301–305. - PubMed
    1. Blander J.M., Sander L.E. Beyond pattern recognition: five immune checkpoints for scaling the microbial threat. Nat Rev Immunol. 2012;12:215–225. - PubMed
    1. Liuzzi A.R., McLaren J.E., Price D.A., Eberl M. Early innate responses to pathogens: pattern recognition by unconventional human T-cells. Curr Opin Immunol. 2015;36:31–37. - PMC - PubMed
    1. Ramilo O., Allman W., Chung W. Gene expression patterns in blood leukocytes discriminate patients with acute infections. Blood. 2007;109:2066–2077. - PMC - PubMed

Publication types

MeSH terms