. 2017 Apr;19(4):271-281.
doi: 10.1038/ncb3493. Epub 2017 Mar 20.

Human haematopoietic stem cell lineage commitment is a continuous process

Affiliations

Human haematopoietic stem cell lineage commitment is a continuous process

Lars Velten et al. Nat Cell Biol. 2017 Apr.

Abstract

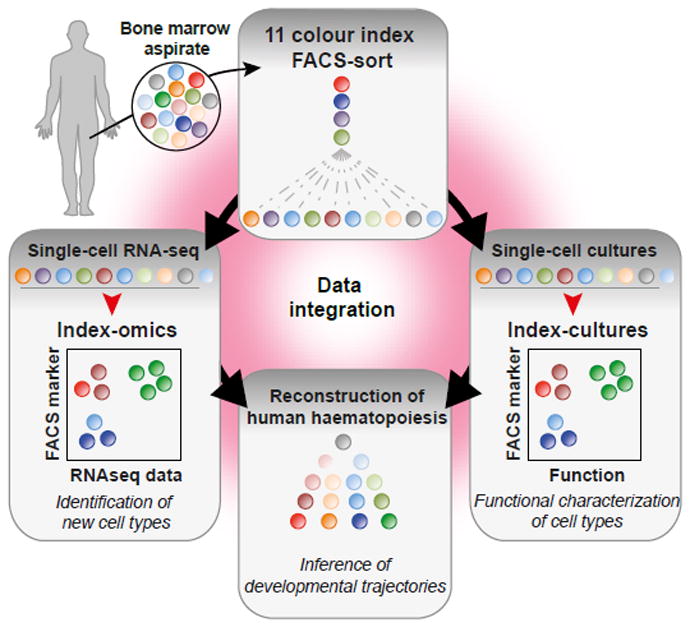
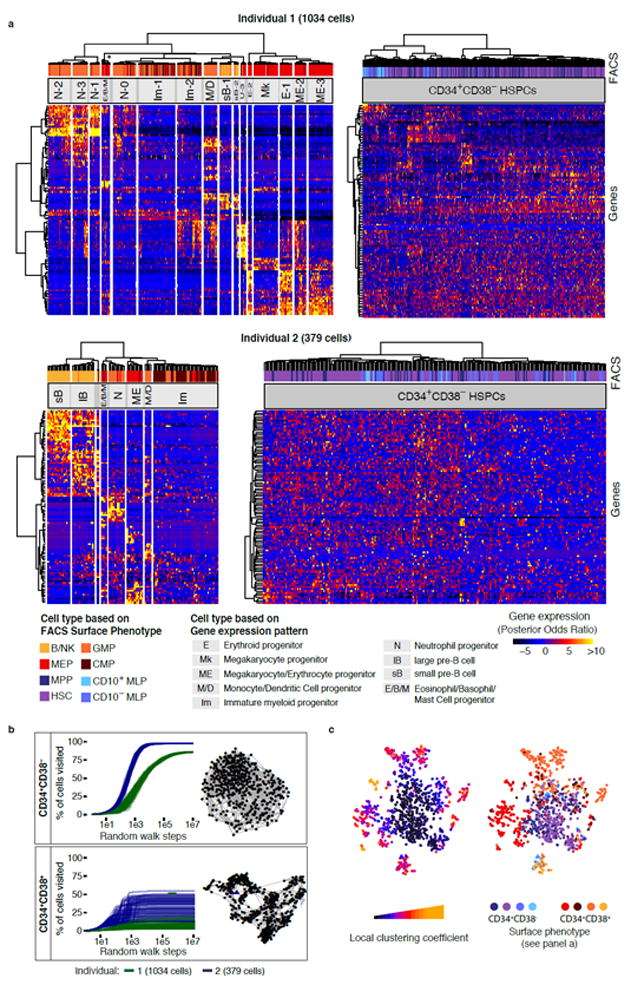
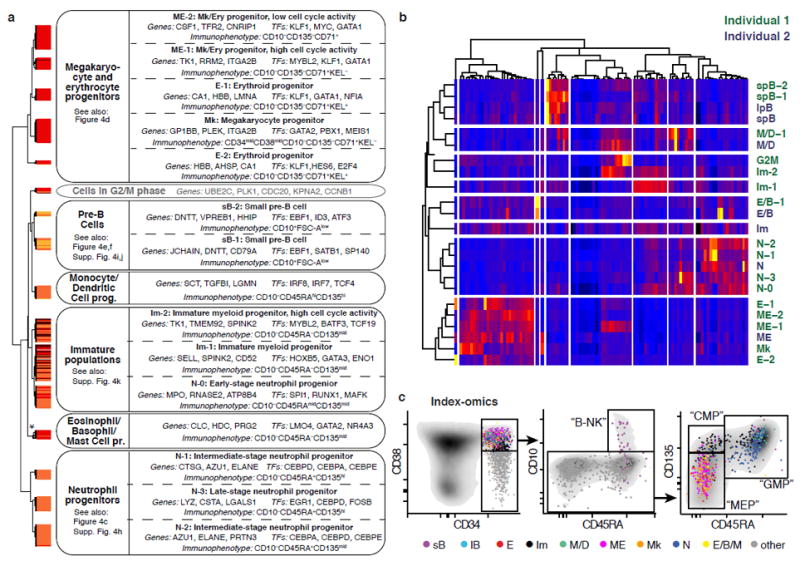
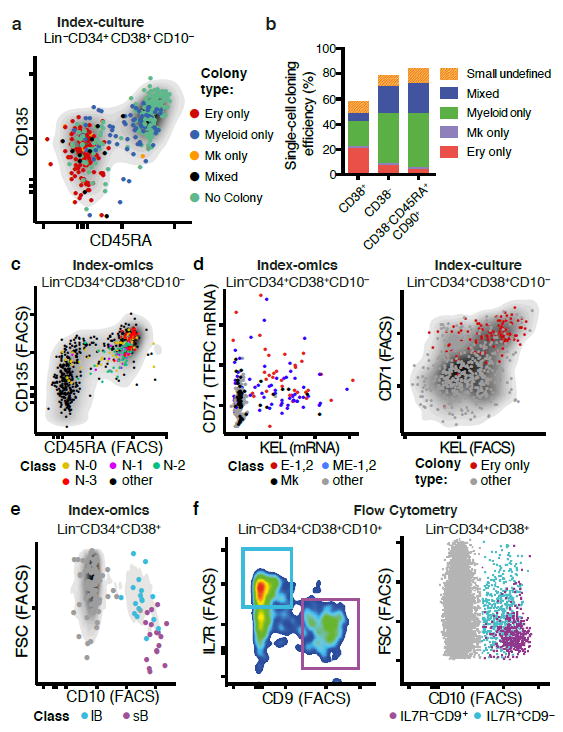
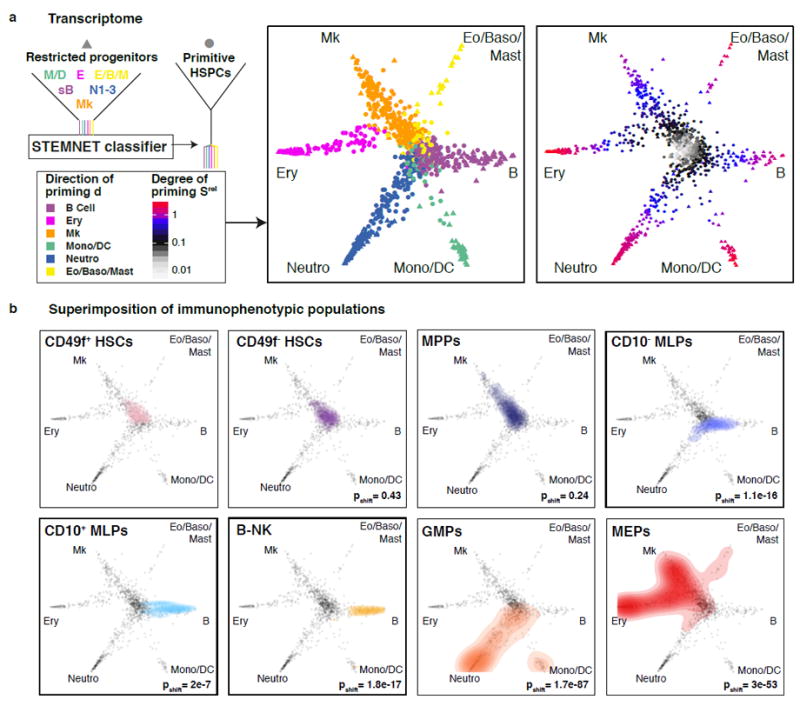
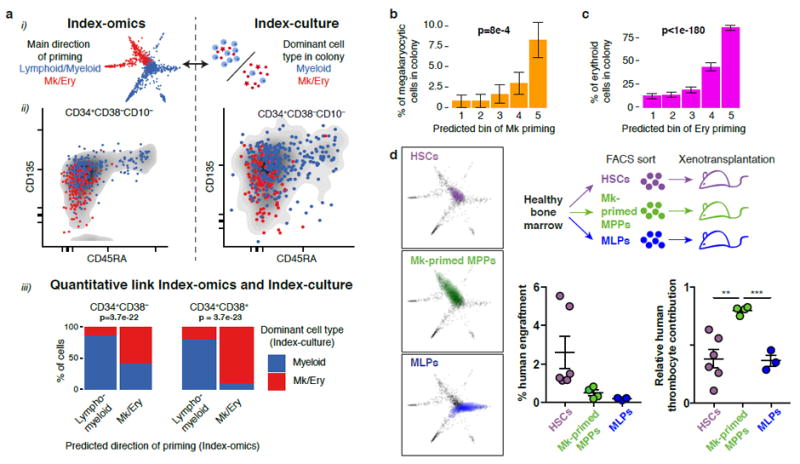
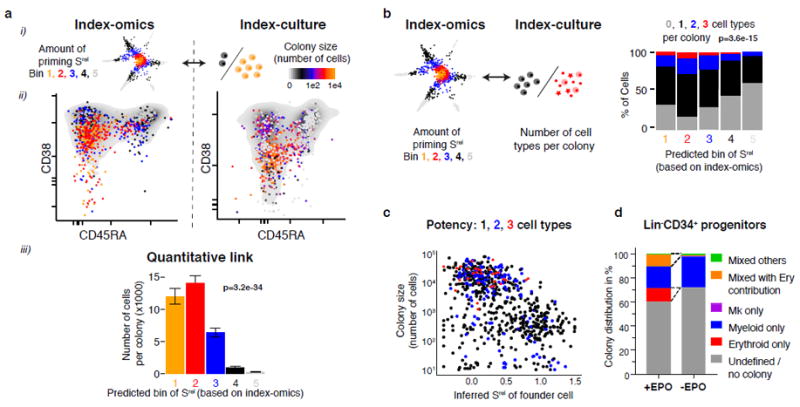
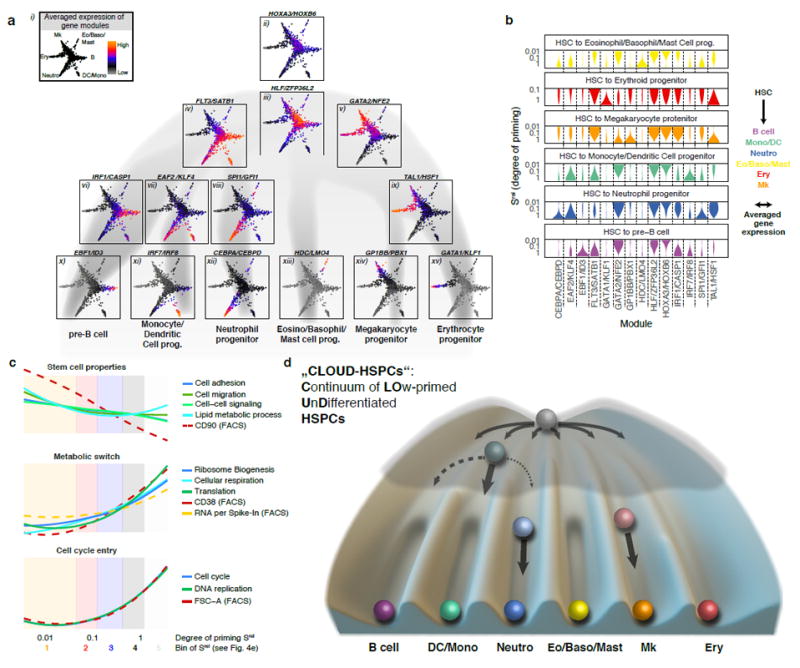
Blood formation is believed to occur through stepwise progression of haematopoietic stem cells (HSCs) following a tree-like hierarchy of oligo-, bi- and unipotent progenitors. However, this model is based on the analysis of predefined flow-sorted cell populations. Here we integrated flow cytometric, transcriptomic and functional data at single-cell resolution to quantitatively map early differentiation of human HSCs towards lineage commitment. During homeostasis, individual HSCs gradually acquire lineage biases along multiple directions without passing through discrete hierarchically organized progenitor populations. Instead, unilineage-restricted cells emerge directly from a 'continuum of low-primed undifferentiated haematopoietic stem and progenitor cells' (CLOUD-HSPCs). Distinct gene expression modules operate in a combinatorial manner to control stemness, early lineage priming and the subsequent progression into all major branches of haematopoiesis. These data reveal a continuous landscape of human steady-state haematopoiesis downstream of HSCs and provide a basis for the understanding of haematopoietic malignancies.


Conflict of interest statement

Author information

The authors declare no competing financial interests.

Figures

Fig. 1
Fig. 1. Experimental strategy
Adult human HSPCs were stained with antibodies against up to 11 surface markers and individually sorted for either single-cell RNA-seq or single-cell cultures. Data from the two experiments were then integrated based on surface marker expression to reconstruct developmental trajectories of haematopoiesis.
Fig. 2
Fig. 2. A stem and progenitor cell continuum precedes the establishment of discrete lineages at the CD34+CD38+ stage
(a) Hierarchical clustering of Lin-CD34+CD38- (Individual 1: 467 cells, Individual 2: 261 cells) and Lin-CD34+CD38+ (I1: 567 cells, I2: 118 cells) compartments for both individuals. Clustering was performed on the most variable 1000 genes of each population. The most variable 100 genes were displayed in the heatmap. The asterisk indicates that 3 putative Eosinophil/Basophil/Mast cell progenitor subclusters of <5 cells were merged. (b) Random walk analysis of Lin-CD34+CD38- and Lin-CD34+CD38+ compartments for both individuals. 100 random walks, i.e. series of random steps from one cell to any of its 5 nearest neighbours in correlation distance space, were simulated and the number of cells reached was evaluated in relation to the total number of cells. 5-Nearest-neighbour networks are depicted on the right. (c) t-SNE visualization of all cells (individual 1) highlighting the degree to which cells are associated with local clusters (left panel, see also methods) and the immunophenotype (right panel).
Fig. 3
Fig. 3. The Lin-CD34+CD38+ compartment consists of distinct lineage-restricted progenitors
(a) Overview of putative cell types in individual 1 (see panel b for a comparison between individuals). Classes obtained from hierarchical clustering of the Lin-CD34+CD38+ compartment (Fig. 2a) were assigned to putative cell types based on analyses of gene- and surface marker expression. The asterisk indicates that 3 putative Eosinophil/Basophil/Mast cell progenitor subclusters of <5 cells were merged for this analyses. (b) Averaged gene expression profiles for cell types from both individuals defined in Fig. 2a were clustered based on the 1000 most variable genes. Only the most variable 100 genes are shown in the heatmap. (c) Index-omics display of Lin-CD34+CD38+ progenitors. Sequenced single Lin-CD34+CD38+ cells were arranged according to their cell surface marker expression in classical FACS gating strategies to identify B- and NK cell progenitors (“B-NK”), Megakaryocytic-Erythroid Progenitors (“MEP”), Common Myeloid Progenitors (“CMP”) and Granulocyte-Monocyte Progenitors (“GMP”). Cells were colour-coded based on their cell type identity from Fig. 3a.
Fig. 4
Fig. 4. Characterization of Lin-CD34+CD38+ lineage restricted progenitors
(a) Index-culture display of Lin-CD34+CD38+ HSPCs. Single HSPCs were cultured for 3 weeks and the resulting colony type was plotted in relation to CD45RA and CD135. (b) Single cells from the ex vivo culture assay were scored as unipotent (gave rise to one lineage) or mixed (gave rise to more than one lineage). (c) Neutrophil-primed subpopulations in relation to CD45RA and CD135 surface marker expression. (d) Megakaryocytic/Erythroid primed subpopulations in relation to TFRC (CD71) mRNA and KEL mRNA expression (left panel) and erythroid colony output in relation to CD71 and KEL surface marker expression (right panel). (e) Pre B-cell subpopulations from individual 2 in relation to CD10 surface expression and forward scatter (FSC). (f) Prospective isolation of B-cell subpopulations sB and lB using classical flow cytometry. FACS markers for IL7R and CD9 permit the separation of two populations with forward scatter (FSC)/CD10 profiles corresponding to sB and lB, as suggested from gene expression data.
Fig. 5
Fig. 5. Visualization of the HSPC continuum
(a) The similarity of every cell to each of the progenitor classes was computed by STEMNET (see methods), projected on a unit circle, and used to quantify the degree and direction of transcriptomic priming. Data from individual 1 is shown, for individual 2 see Supplementary Fig. 5a, b. (b) Immunophenotypic populations, were highlighted on the HSPC continuum. P-values were calculated by kernel-density based tests comparing each population to CD49f+ HSCs. For CMPs, see Supplementary Fig. 5h,i. For CD49f+ HSCs, n=101 single cells; CD49f- HSCs, n=117; MPPs, n=176; CD10- MLPs, n=52; CD10+MLPs, n=16; B-NKs, n=26; GMPs, n=244; MEPs, n=231
Fig. 6
Fig. 6. The direction of transcriptomic priming is quantitatively linked to functional lineage potential
(a) Comparison of the predominant direction of priming d (lympho/myeloid versus megakaryocyte/erythroid) obtained from single-cell transcriptomics to the dominant cell type observed in colonies from single-cell culture. (i) Illustration. (ii) Qualitative comparison of the two quantities with respect to CD45RA and CD135 surface marker expression. (iii) Quantitative link. The most likely dominant direction of priming was estimated for each founder cell from index-culture based on regression models constructed on all surface markers and compared to the observed colony composition (see Supplementary Fig. 7a). p values are from a Fisher test with n=434 cells (left panel) and n=193 cells (right panel). (b) Comparison between inferred amount of transcriptomic Mk-priming and the percentage of CD41+ Mk-cells per colony. Errors bars denote S.E.M. p-value is from a Pearson product moment correlation test with n=627 single cells that formed colonies. See also Supplementary Fig. 7c. (c) Comparison between inferred amount of transcriptomic erythroid-priming and the percentage of CD235+ erythroid cells per colony. See also Supplementary Fig. 7c. Errors bars denote S.E.M. p-value is from a Pearson product moment correlation test with n=627 single cells that formed colonies. (d) Xenotransplantation validating a Mk-primed MPP population identified by STEMNET. HSCs, MLPs, and a population of putatively Mk-primed MPPs (Lin-CD34+CD38-CD45RA-CD90-CD135-) were sorted, transplanted into immunocompromised mice and chimerism of human lymphomyeloid cells (CD45+), thrombocytes and erythrocytes was determined 2 weeks post transplantation. Experimental setup (top right panel), localization of populations in STEMNET (left panels), and human engraftment (right panels, error bars denote SEM) are indicated. Relative contribution of thrombocytes was significantly higher in MK-primed MPPs compared to HSC (p=0.0031) and MLPs (p=0.0002, two-tailed unpaired t test, n=6 HSCs, n=4 Mk-primed MPPs, n=3 MLPs)
Fig. 7
Fig. 7. The degree of transcriptomic priming is quantitatively linked to multipotency and proliferative capacity
(a) Comparison between the inferred amount of transcriptomic priming Srel of the founder cell and the resulting colony size (cell number). (i) illustration, (ii) qualitative link and (iii) quantitative link. Errors bars denote S.E.M. p-value is from a Pearson product moment correlation test with n=1031 single cells. (b) Comparison between the inferred amount of priming Srel of the founder cell and the number of cell types in the colony. p-value is from a Pearson product moment correlation test with n=1031 single cells. (c) Inferred transcriptomic degree of priming Srel (x-axis) in relation to the colony size (y-axis) and the number of cell types per colony (colour-code). (d) Distribution of colony types in relation to the presence or absence of erythropoietin (EPO) in the culture medium.
Fig. 8
Fig. 8. Lineage commitment is a layered multi-step process
(a, b) Activity of gene modules associated with developmental progression of HSPCs. Genes depending on the degree and/or direction of priming were identified and clustered into modules displaying similar expression patterns (see methods). Averaged gene expression of selected modules from individual 1 was highlighted in the HSPC differentiation continuum (a) or smoothened and plotted against the degree of lineage-specific priming (b). For a complete list of modules and individual 2, see Supplementary Fig. 8 and Supplementary Table 4. (c) Gene ontology and FACS marker changes along the early priming of HSPCs (Srel < 0.4). During later stages of priming, GO activity and FACS marker expression additionally depend on the direction of priming (not shown). (d) Graphical summary of a continuum-based model of bone marrow haematopoiesis. Due to the interactions of gene regulatory networks, some cell states and transitions are more likely than others, represented by a lower elevation within a Waddington landscape. During early lineage commitment, small barriers between lineages arise early, thereby creating lineage biases in HSCs. At the progenitor stage these barriers are already more pronounced, making the oligopotent stage less likely. Note that T- and NK-cell development predominantly occurs outside the bone marrow.

Comment in

Similar articles

Cited by

References

    1. Chao MP, Seita J, Weissman IL. Establishment of a normal hematopoietic and leukemia stem cell hierarchy. Cold Spring Harb Symp Quant Biol. 2008;73:439–449. - PubMed
    1. Morrison S, Uchida N, Weissman I. The biology of hematopoietic stem cells. Annu Rev Cell Dev Biol. 1995;11:35–71. - PubMed
    1. Kondo M, Weissman IL, Akashi K. Identification of clonogenic common lymphoid progenitors in mouse bone marrow. Cell. 1997;91:661–672. - PubMed
    1. Akashi K, Traver D, Miyamoto T, Weissman IL. A clonogenic common myeloid progenitor that gives rise to all myeloid lineages. Nature. 2000;404:193–197. - PubMed
    1. Doulatov S, et al. Revised map of the human progenitor hierarchy shows the origin of macrophages and dendritic cells in early lymphoid development. Nat Immunol. 2010;11:585–93. - PubMed

Publication types