

doi: 10.1038/nmeth.4227.
Epub 2017 Mar 20.
Accurate identification of single-nucleotide variants in whole-genome-amplified single cells
Affiliations
- PMID: 28319112
- PMCID: PMC5408311
- DOI: 10.1038/nmeth.4227
Item in Clipboard
Accurate identification of single-nucleotide variants in whole-genome-amplified single cells
Nat Methods.
2017 May.
Abstract
Mutation analysis in single-cell genomes is prone to artifacts associated with cell lysis and whole-genome amplification. Here we addressed these issues by developing single-cell multiple displacement amplification (SCMDA) and a general-purpose single-cell-variant caller, SCcaller (https://github.com/biosinodx/SCcaller/). By comparing SCMDA-amplified single cells with unamplified clones from the same population, we validated the procedure as a firm foundation for standardized somatic-mutation analysis in single-cell genomics.
Conflict of interest statement
X.D., L.Z., M.L., A.M. and J.V. are co-founders of SingulOmics Corp.
Figures
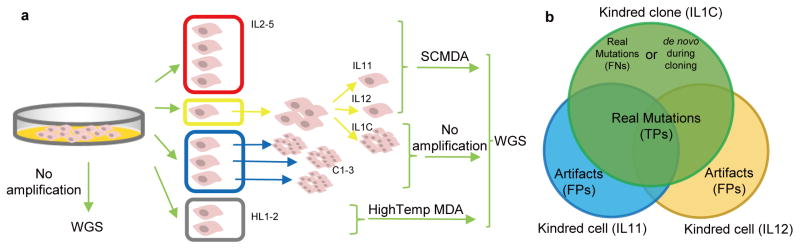
(a) To allow validation for accurate single cell amplification and variant calling, whole genome sequencing (WGS) was performed on (1) four single cells amplified using SCMDA (red); (2) two cells amplified using SCMDA and their non-amplified kindred clone (yellow); (3) three additional, unamplified clones (blue); and (4) two single cells amplified after high temperature lysis (grey). Cell / clone IDs are included in the Figure. (b) The kindred cells and clone are expected to have identical genotypes, including both germline and somatic SNVs. Candidate SNVs identified in both clone and single cells are true positives (TPs). Those found in neither of the cells but only in the clone are false negatives (FNs). Variants found only in one cell are considered false positives (FPs). See Supplementary Note for details. These are conservative assumptions and do not take into account possible de novo mutations in the kindred clone or single cells arising after their divergence. Of note, such events would increase sensitivity and specificity.

Sensitivity and FP rate of germline SNP calling in cell IL11 (a) and IL12 (b). Sensitivity (y-axis) was defined as the ratio of TPs to FNs plus TPs. FP rate per MB on the x-axis is the number of FPs per million bp. Default cutoff (x) refers to α=0.01 by SCcaller. (c) Germline SNP calling using SCcaller was compared with Monovar and Haplotypecaller in a dataset from Lodato et al.. On the x-axis, the number of artifacts was approximated as the number of SNVs unique to one cell (Supplementary Note). Since these unique SNVs also include real somatic SNVs, this approximation is the upper-bound of the number of artifacts. SCcaller suffered from the smallest number of false positives (<1,000 per cell), as compared to Haplotypecaller (>30,000 per cell) and Monovar (>5,000 per cell). For somatic SNV calling, SCcaller was compared with MuTect, VarScan and Monovar in cell IL11 (d) and IL12 (e). FDR was defined as the ratio of FPs to TPs plus FPs. TPs and FPs were derived from the kindred clone experiment (Fig. 1b, Supplementary Note). (f) Fraction of overlapping somatic SNVs called from MALBAC kindred single cells (Supplementary Note). SNPs and SNVs were called in regions with ≥20 sequencing depth. The error bars indicate standard deviations.
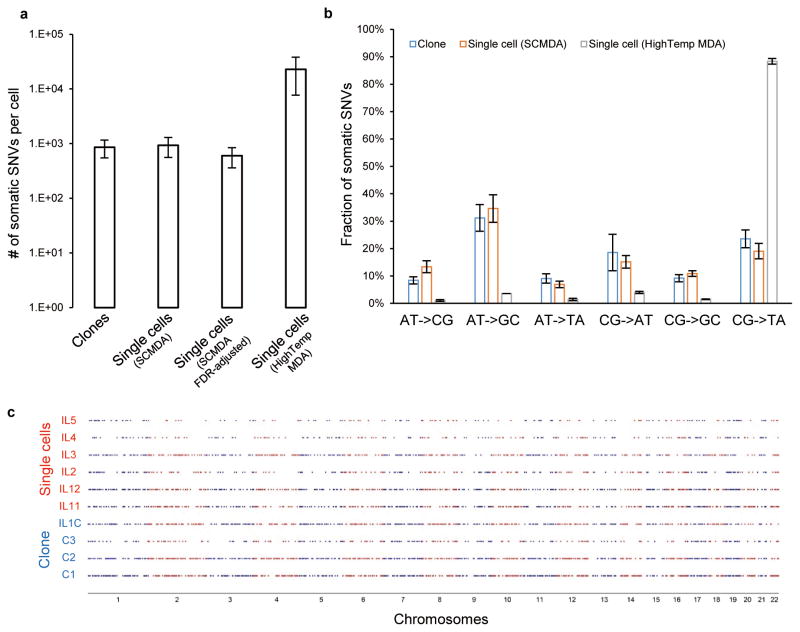
(a) Number of somatic SNVs per cell after correction for sequence depth and coverage (Supplementary Note). (b) Spectrum of somatic SNVs. In a) and b), the error bars indicate standard deviations, and n=4, 6 and 2 for the clones, SCMDA and HighTemp MDA respectively. (c) Genome distribution of somatic SNVs identified. Each row indicates one single cell or clone and each dot represents a somatic SNV. Smaller numbers of somatic SNVs were identified in IL4 and IL5 due to lower sequencing depth (Supplementary Table 3).
References
-
- Fryxell KJ, Zuckerkandl E. Cytosine deamination plays a primary role in the evolution of mammalian isochores. Molecular biology and evolution. 2000;17:1371–1383. - PubMed
MeSH terms
Substances
Grants and funding
LinkOut - more resources
Full Text Sources
Other Literature Sources
