

Different subregional metabolism patterns in patients with cerebellar ataxia by 18F-fluorodeoxyglucose positron emission tomography
- PMID: 28319124
- PMCID: PMC5358749
- DOI: 10.1371/journal.pone.0173275
Different subregional metabolism patterns in patients with cerebellar ataxia by 18F-fluorodeoxyglucose positron emission tomography
Abstract
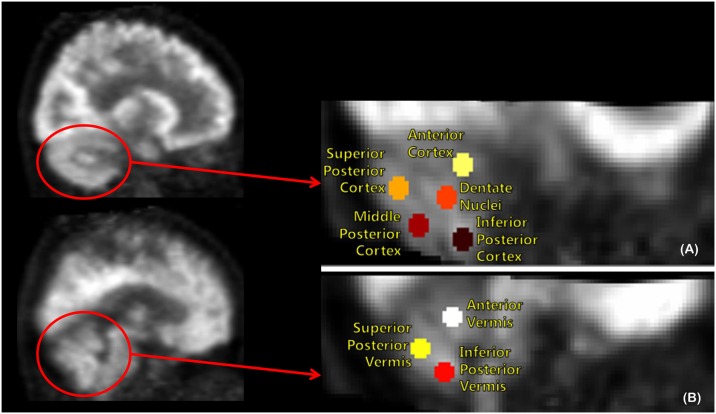
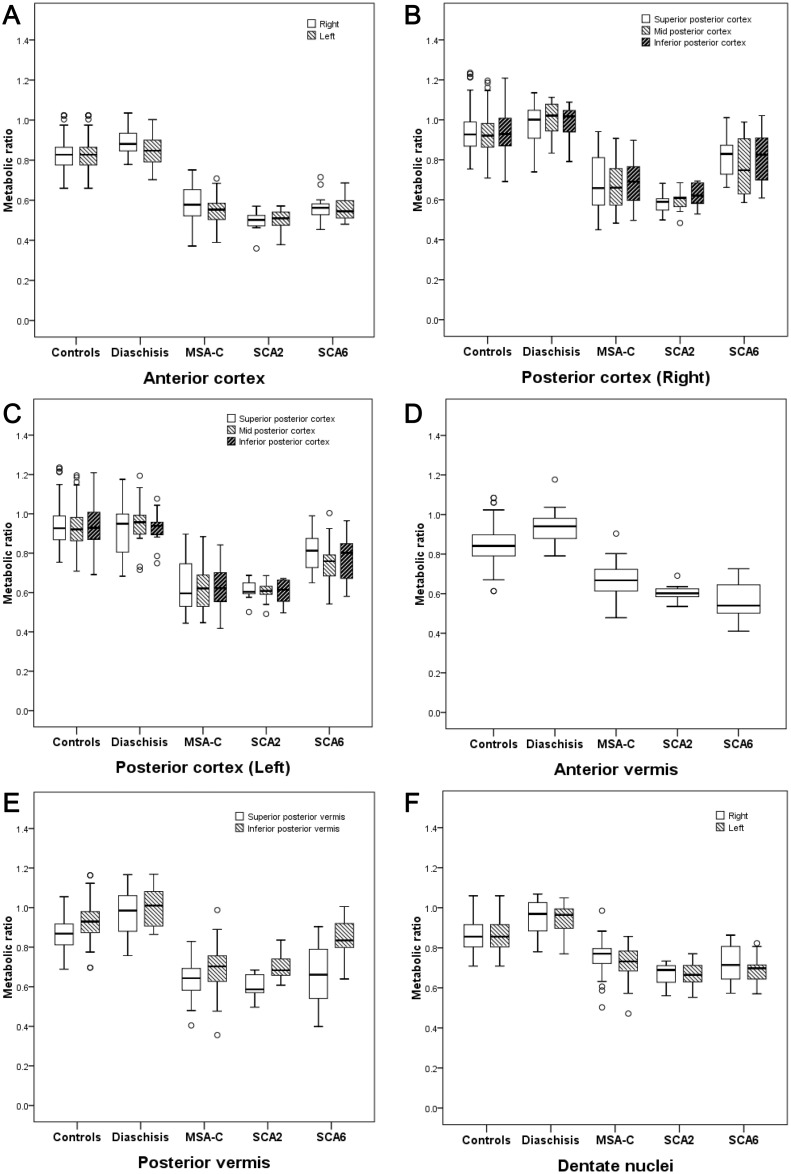
We evaluated cerebellar subregional metabolic alterations in patients with cerebellar ataxia, a representative disease involving the spinocerebellum. We retrospectively analyzed 18F-fluorodeoxyglucose positron emission tomography (18F-FDG PET) images in 44 patients with multiple system atrophy of the cerebellar type (MSA-C), 9 patients with spinocerebellar ataxia (SCA) type 2, and 14 patients with SCA type 6 and compared with 15 patients with crossed cerebellar diaschisis (CCD) and 89 normal controls. Cerebellar subregional metabolism was assessed using 13 cerebellar subregions (bilateral anterior lobes [ANT], superior/mid/inferior posterior lobes [SUPP/MIDP/INFP], dentate nucleus [DN], anterior vermis [ANTV], and superior/inferior posterior vermis [SUPV/INFV]) to determine FDG uptake ratios. MSA-C and SCA type 2 showed severely decreased metabolic ratios in all cerebellar subregions compared to normal controls (ANT, 0.58 ± 0.08 and 0.50 ± 0.06 vs. 0.82 ± 0.07, respectively, p < 0.001). SCA type 6 showed lower metabolic ratios in almost all cerebellar subregions (ANT, 0.57 ± 0.06, p < 0.001) except INFV. Anterior-posterior lobe ratio measurements revealed that SCA type 2 (Right, 0.81 ± 0.05 vs. 0.88 ± 0.04, p < 0.001; Left, 0.83 ± 0.05 vs. 0.88 ± 0.04, p = 0.003) and SCA type 6 (Right, 0.72 ± 0.05 vs. 0.88 ± 0.04, p < 0.001; Left, 0.72 ± 0.05 vs. 0.88 ± 0.04, p < 0.001) showed preferential hypometabolism in the anterior lobe compared to normal controls, which was not observed in CCD and MSA-C. Asymmetric indices were higher in CCD and MSA-C than in normal controls (p < 0.001), whereas such differences were not found in SCA types 2 and 6. In summary, quantitative analysis of cerebellar subregional metabolism ratios revealed preferential involvement of the anterior lobe, corresponding to the spinocerebellum, in patients with cerebellar ataxia, whereas patients with CCD and MSA-C exhibited more asymmetric hypometabolism in the posterior lobe.
Conflict of interest statement
Figures
Similar articles
-
Cerebellum-specific 18F-FDG PET analysis for the detection of subregional glucose metabolism changes in spinocerebellar ataxia.Neuroreport. 2014 Oct 22;25(15):1198-202. doi: 10.1097/WNR.0000000000000247. Neuroreport. 2014. PMID: 25144395
-
Different loss of dopamine transporter according to subtype of multiple system atrophy.Eur J Nucl Med Mol Imaging. 2016 Mar;43(3):517-25. doi: 10.1007/s00259-015-3191-6. Epub 2015 Sep 19. Eur J Nucl Med Mol Imaging. 2016. PMID: 26384682
-
Comparison of imaging using 11C-ITMM and 18F-FDG for the detection of cerebellar ataxia.J Neurol Sci. 2017 Apr 15;375:97-102. doi: 10.1016/j.jns.2017.01.036. Epub 2017 Jan 12. J Neurol Sci. 2017. PMID: 28320199
-
Relationship between type 1 metabotropic glutamate receptors and cerebellar ataxia.J Neurol. 2016 Nov;263(11):2179-2187. doi: 10.1007/s00415-016-8248-3. Epub 2016 Aug 8. J Neurol. 2016. PMID: 27502082
-
Effects of disease duration on the clinical features and brain glucose metabolism in patients with mixed type multiple system atrophy.Brain. 2008 Feb;131(Pt 2):438-46. doi: 10.1093/brain/awm328. Epub 2008 Jan 4. Brain. 2008. PMID: 18178568
Cited by
-
Crossed cerebellar diaschisis on 18F-FDG PET: Frequency across neurodegenerative syndromes and association with 11C-PIB and 18F-Flortaucipir.J Cereb Blood Flow Metab. 2021 Sep;41(9):2329-2343. doi: 10.1177/0271678X211001216. Epub 2021 Mar 10. J Cereb Blood Flow Metab. 2021. PMID: 33691512 Free PMC article.
-
Neuroimaging Biomarkers in SCA2 Gene Carriers.Int J Mol Sci. 2020 Feb 4;21(3):1020. doi: 10.3390/ijms21031020. Int J Mol Sci. 2020. PMID: 32033120 Free PMC article. Review.
-
Methylphenidate's effects on thalamic metabolism and functional connectivity in cannabis abusers and healthy controls.Neuropsychopharmacology. 2019 Jul;44(8):1389-1397. doi: 10.1038/s41386-018-0287-2. Epub 2018 Dec 1. Neuropsychopharmacology. 2019. PMID: 30504928 Free PMC article. Clinical Trial.
-
[18F]FDG PET in conditions associated with hyperkinetic movement disorders and ataxia: a systematic review.Eur J Nucl Med Mol Imaging. 2023 Jun;50(7):1954-1973. doi: 10.1007/s00259-023-06110-w. Epub 2023 Jan 27. Eur J Nucl Med Mol Imaging. 2023. PMID: 36702928 Free PMC article.
-
Spinocerebellar ataxia clinical trials: opportunities and challenges.Ann Clin Transl Neurol. 2021 Jul;8(7):1543-1556. doi: 10.1002/acn3.51370. Epub 2021 May 21. Ann Clin Transl Neurol. 2021. PMID: 34019331 Free PMC article. Review.
References
-
- Abele M, Burk K, Schols L, Schwartz S, Besenthal I, Dichgans J, et al. The aetiology of sporadic adult-onset ataxia. Brain. 2002; 125: 961–968. - PubMed
-
- Wenning GK, Geser F. Multiple system atrophy. Rev Neurol (Paris). 2003; 159: 3S31–38. - PubMed
-
- Hughes AJ, Daniel SE, Ben-Shlomo Y, Lees AJ. The accuracy of diagnosis of parkinsonian syndromes in a specialist movement disorder service. Brain. 2002; 125: 861–870. - PubMed
MeSH terms
Substances
LinkOut - more resources
Full Text Sources
Other Literature Sources
