. 2017 May;20(5):717-726.
doi: 10.1038/nn.4533. Epub 2017 Mar 20.

Capillary K+-sensing initiates retrograde hyperpolarization to increase local cerebral blood flow

Affiliations

Capillary K+-sensing initiates retrograde hyperpolarization to increase local cerebral blood flow

Thomas A Longden et al. Nat Neurosci. 2017 May.

Abstract

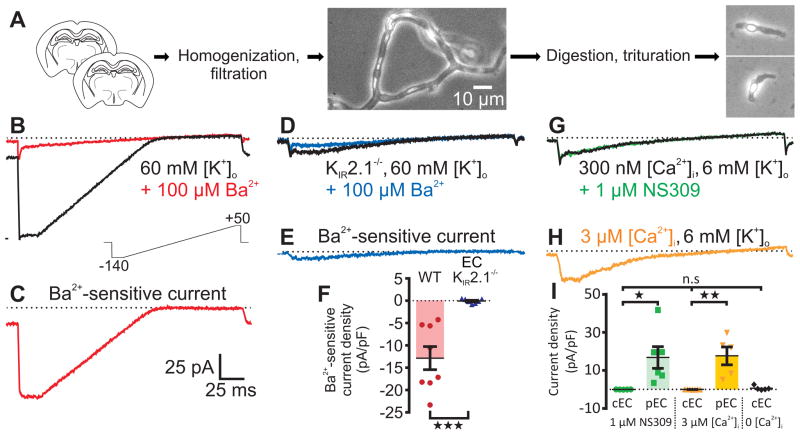
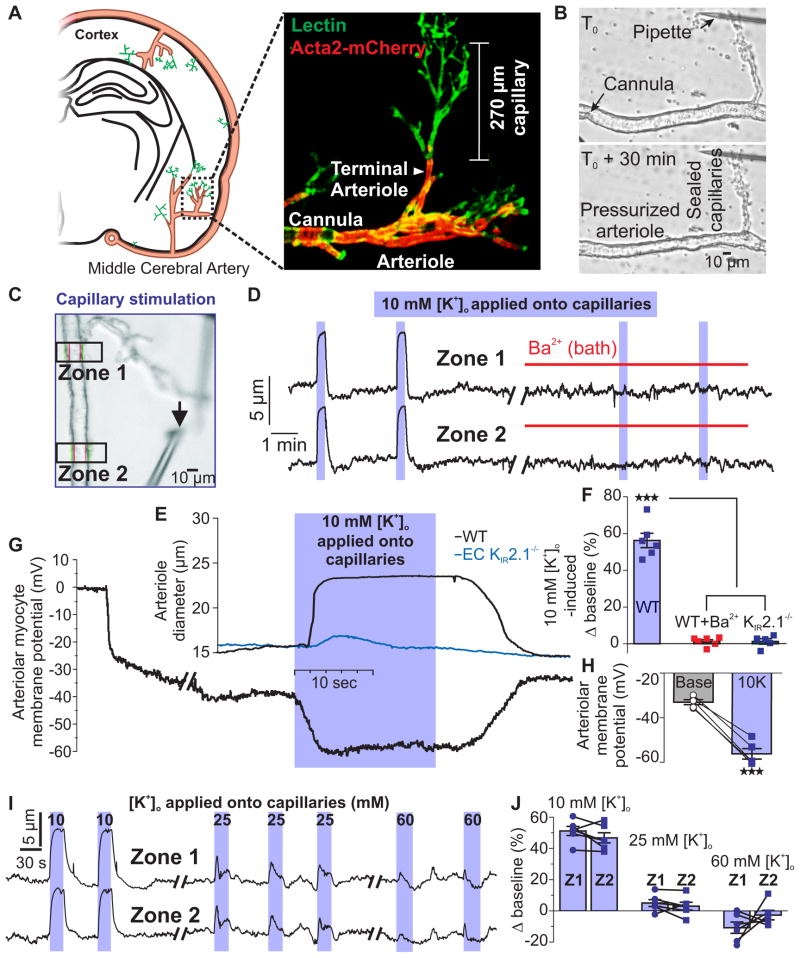
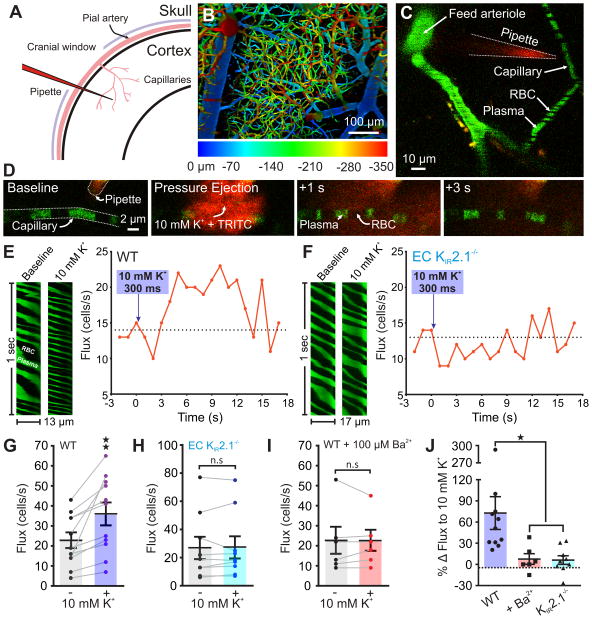
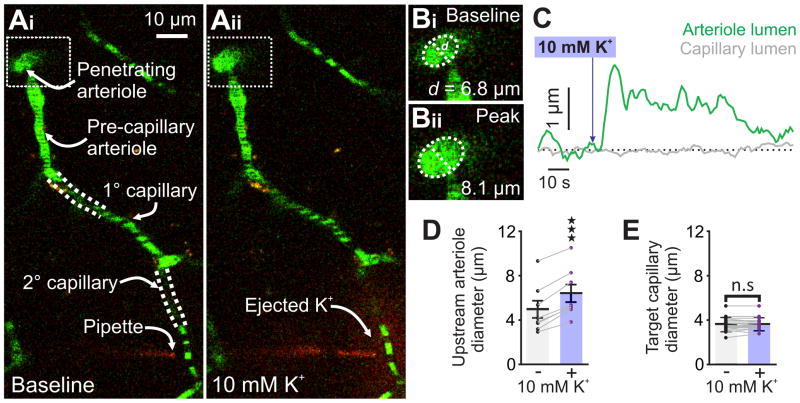
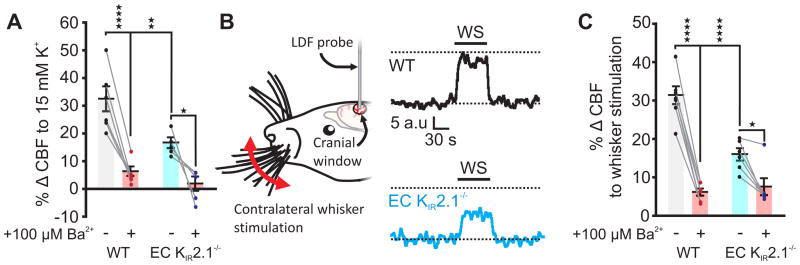
Blood flow into the brain is dynamically regulated to satisfy the changing metabolic requirements of neurons, but how this is accomplished has remained unclear. Here we demonstrate a central role for capillary endothelial cells in sensing neural activity and communicating it to upstream arterioles in the form of an electrical vasodilatory signal. We further demonstrate that this signal is initiated by extracellular K+ -a byproduct of neural activity-which activates capillary endothelial cell inward-rectifier K+ (KIR2.1) channels to produce a rapidly propagating retrograde hyperpolarization that causes upstream arteriolar dilation, increasing blood flow into the capillary bed. Our results establish brain capillaries as an active sensory web that converts changes in external K+ into rapid, 'inside-out' electrical signaling to direct blood flow to active brain regions.


Conflict of interest statement

COMPETING FINANCIAL INTERESTS

None.

Figures

Fig. 1
Fig. 1
Capillary ECs possess functional KIR channels, but lack SK and IK channels. (A) Overview of cell isolation. Left to right: Two brain slices were homogenized then filtered to yield branching capillaries. Extracellular matrix was enzymatically removed and capillaries were triturated to yield single cells. Scale bar applies to all micrographs. (B) With 60 mM [K+]o to increase KIR conductance, a 200-ms voltage ramp from −140 to +50 mV (lower inset) generated whole-cell currents (black trace) with a large inward component at hyperpolarized potentials. Superfusion of 100 μM Ba2+ (red trace) eliminated evoked currents. (C) Subtracted 100 μM Ba2+-sensitive currents reveal a classic strongly rectifying K+ current. (D) 100 μM Ba2+ (blue) was without effect on capillary ECs from EC KIR2.1−/− mice. (E) Subtracted 100 μM Ba2+-sensitive current from the KIR2.1−/− capillary EC in D. (F) Comparison of Ba2+-sensitive capillary EC current density at −140 mV in WT C57BL/6 (n = 8 cells, 8 mice) and EC KIR2.1−/− (n = 7 cells, 7 mice) mice (***P = 0.0005 (t13 = 4.587) unpaired Student’s t-test). (G) With 6 mM [K+]o and 300 nM [Ca2+]i, 1 μM NS309 had no effect on capillary EC currents. (H) Dialyzing with 3 μM Ca2+ did not affect membrane currents. (I) Summary data at 0 mV. NS309 (1 μM) had no effect on capillary ECs (cEC; n = 5 cells, 3 mice), but evoked large currents in control pial ECs (pEC; n = 6 cells, 4 mice; *P = 0.0253 (t9 = 2.678) unpaired Student’s t-test). Currents were absent in capillary ECs dialyzed with 3 μM [Ca2+]i (n = 7 cells, 2 mice), in contrast to pial ECs, which developed prominent K+ currents upon dialysis of 3 μM Ca2+ (n = 5 cells, 4 mice; **P = 0.0011 (t10 = 4.548) unpaired Student’s t-test). Dialysis with a solution containing 0 Ca2+ and 5 mM EGTA had no effect on capillary EC currents compared with cells dialyzed with 300 nM or 3 μM Ca2+ (n = 5 cells from 2 mice; P = 0.251 (FDFn,DFd = 1.5282,14) one-way ANOVA). All error bars represent s.e.m.
Fig. 2
Fig. 2
Application of K+ to capillaries causes rapid upstream parenchymal arteriole dilation ex vivo. (A) Left: CaPA preparations were obtained from the middle cerebral artery region. Right: Typical CaPA preparation from an Acta2 GCaMP5-mCherry mouse (see Online Methods) showing SM (red) giving way to branching capillaries (lectin; green). Each CaPA preparation consists of an arteriole segment (320 μm ± 14 μm long, n = 16) and a capillary tree composed of one first-order branch (168 ± 12 μm long) with an average of 4 ± 1 second-order branches (100 ± 8 μm long). (B) Constriction of the arteriole to 40 mm Hg in a CaPA preparation. (C) Pipette position for capillary stimulation by pressure ejection. Black arrow indicates the tip of the pipette. Diameter was simultaneously recorded in two zones (boxes). The average distance from the capillary stimulation site to Zone 1 was 226 ± 19 μm. (D) Arteriolar diameter at Zone 1 and Zone 2 in a CaPA preparation. Application of 10 mM K+ (5 psi) to capillaries produced rapid upstream arteriolar dilation, which was blocked by 30 μM Ba2+. (E) Expanded trace showing parenchymal arteriole dilation at Zone 2 to capillary stimulation with 10 mM K+ for 18 s in preparations from WT C57BL/6 (black trace) and EC KIR2.1−/− (blue trace) mice. (F) Summary data showing diameter changes in Zone 2 induced by 10 mM K+ applied directly onto capillaries in WT preparations (n = 6 preparations, 6 mice) before and after 30 μM Ba2+ and in EC KIR2.1−/− preparations (n = 5 preparations, 5 mice; ***P < 0.0001, (FDFn,DFd = 154.82,14) one-way ANOVA followed by Tukey’s multiple comparisons test). (G) Membrane potential of SM cells at Zone 2 in a pressurized (40 mm Hg) arteriolar segment during application of 10 mM K+ onto capillaries. (H) Summary data showing membrane potential before and after application of 10 mM K+ for 18 s to capillaries (n = 5 preparations, 5 mice; ***P = 0.0002, (t4 = 12.94) paired Student’s t-test). (I) Effects of capillary application of 10, 25, and 60 mM external K+ on arteriolar diameter at Zone 1 and Zone 2. (J) Summary data showing diameter changes in Zone 1 and Zone 2 induced by 10, 25, and 60 mM K+ applied directly onto capillaries. Responses to 25 and 60 mM K+ compared to baseline diameter and between Zone 1 and Zone 2 were not significantly different (n = 6 preparations, 6 mice; baseline vs 25 mM K+: P = 0.1128, (t5 = 1.921); baseline vs 60 mM K+: P = 0.4984, (t5 = 0.7296); Zone 1 vs Zone 2: P = 0.3908, (t5 = 0.9390) at 25 mM K+, and P = 0.2580, (t5 = 1.276) at 60 mM K+, paired Student’s t-test). All error bars represent s.e.m.
Fig. 3
Fig. 3
K+ causes capillary hyperemia in vivo through KIR2.1 channel activation. (A) Experimental paradigm. Mice were injected with FITC-dextran, then equipped with a cranial window through which the cerebral circulation was visualized using 2-photon laser-scanning microscopy (2PLSM). (B) Depth-coded micrograph of an area of the cortical vasculature. Capillaries downstream of penetrating parenchymal arterioles were identified for further analysis. (C) A pipette containing aCSF with 3 or 10 mM K+ plus TRITC-dextran was introduced next to a capillary, which was then line-scanned at 5 kHz during local pressure ejection of the pipette contents. (D) Micrographs depicting (left to right) the evolution of TRITC diffusion (red) after pressure ejection of 10 mM K+ (200 ms, 4 psi) onto a capillary (green). The brevity and low pressure of the ejection conditions ensured that K+ remained local. (E) Left: Baseline and peak distance-time plots of capillary line scans showing hyperemia to the ejection of 10 mM K+ onto a capillary. RBCs passing through the line-scanned capillary appear as black shadows against green fluorescent plasma. Right: Typical experimental time-course for a WT mouse showing RBC flux binned at 1-s intervals before and after pressure ejection of 10 mM K+ (300 ms, 8 psi; purple arrow) onto a capillary, demonstrating hyperemia to K+ delivery. (F) Left: Line scan plots for an experiment in which 10 mM K+ was pressure ejected onto a capillary in an EC KIR2.1−/− mouse, illustrating an absence of hyperemia to this maneuver. Right: Typical flux-time trace for an EC KIR2.1−/− mouse capillary. Pressure ejection of 10 mM K+ (300 ms, 8 psi; purple arrow) did not evoke hyperemia. (G) Summary RBC flux responses to 10 mM K+ in WT mice. K+ delivery caused significant hyperemia (n = 11 paired experiments, 11 mice; **P = 0.0038 (t10 = 3.75) paired Student’s t-test). (H) Summary data for EC KIR2.1−/− mice (n = 9 paired experiments, 9 mice). 10 mM K+ did not evoke hyperemia (P = 0.8265 (t8 = 0.2265) paired Student’s t-test). (I) Ba2+ (100 μM), applied to the cranial surface, inhibited capillary hyperemia to 10 mM K+ (n = 6 paired experiments, 6 mice; P > 0.99 (t5 = 0) paired Student’s t-test). (J) Change in RBC flux expressed as a percentage of baseline for each experimental group (*P = 0.016 vs. WT, FDFn,DFd = 4.9742,23, one-way ANOVA with Holm-Sidak’s multiple comparison test). All error bars represent s.e.m.
Fig 4
Fig 4
10 mM K+ applied to capillaries causes upstream arteriolar dilation in vivo. (Ai) Micrograph illustrating pipette placement adjacent to a second-order capillary for in vivo monitoring of the diameter of the upstream feed arteriole (boxed). White dashed lines indicate that capillaries are connected into a single tree despite deviating from the imaging plane. (Aii) The same experiment, after pressure ejection of 10 mM K+ and TRITC (red) around the capillary. Note the dilation in the feed arteriole (boxed). (B) Magnification of the boxed areas around the feed arteriole in Ai and Aii, illustrating the magnitude of dilation evoked by capillary stimulation with 10 mM K+. (C) Traces illustrating the luminal diameter of a pre-capillary arteriole (green) and the stimulated capillary (grey) before and after stimulation with 10 mM K+. Delivery of K+ produced a robust dilation in the arteriole, but not the capillary. (D) Summary data showing arteriole diameter before and after capillary application of 10 mM K+, which produced significant upstream arteriole dilation (n = 8 paired experiments, 7 mice; ****P < 0.0001 (t7 = 10.86) paired Student’s t-test). (E) Summary data showing target capillary diameter before and after capillary application of 10 mM K+, which had no effect (n = 18 capillaries, 7 mice P = 0.6014 (t17 = 0.5324) paired Student’s t-test). All error bars represent s.e.m.
Fig. 5
Fig. 5
EC KIR2.1 channels are essential for functional hyperemia. (A) Summary data for 15 mM K+-evoked hyperemia. Responses in WT mice were severely attenuated by 100 μM Ba2+. Responses in EC KIR2.1−/− mice were significantly smaller than those from WT mice and almost abrogated by 100 μM Ba2+ (WT, n = 6 mice; EC KIR2.1−/−, n = 5 mice. ****P < 0.0001 (q18 = 9.033), **P = 0.0083 (q18 = 5.214), *P = 0.0187 (q18 = 4.676); two-way ANOVA with Tukey’s multiple comparisons test). (B) Left: Whisker stimulation experimental paradigm. Right: Typical traces illustrating the hyperemic response to whisker stimulation (WS), measured using laser Doppler flowmetry (LDF). Hyperemia in EC KIR2.1−/− mice (blue) was markedly blunted compared with that in WT mice (black). Black dashed lines represent baseline and peak WT response for comparison. (C) Summary data for functional hyperemia, indicating that responses in WT mice are driven by a substantial Ba2+-sensitive component, which is greatly diminished in EC KIR2.1−/− mice (WT, n = 7 mice; EC KIR2.1−/−, n = 6 mice; ****P < 0.0001 (q22 = 14.3 WT vs. Ba2+, and 8.396 WT vs. EC KIR2.1−/−), *P = 0.0238 (q22 = 4.413); two-way ANOVA with Tukey’s multiple comparisons test). All error bars represent s.e.m.

Comment in

Similar articles

Cited by

References

    1. Iadecola C, Nedergaard M. Glial regulation of the cerebral microvasculature. Nat Neurosci. 2007;10:1369–1376. - PubMed
    1. Uhlirova H, et al. Cell type specificity of neurovascular coupling in cerebral cortex. Elife. 2016;5:e14315. - PMC - PubMed
    1. Attwell D, et al. Glial and neuronal control of brain blood flow. Nature. 2010;468:232–243. - PMC - PubMed
    1. Nishimura N, Schaffer CB, Friedman B, Lyden PD, Kleinfeld D. Penetrating arterioles are a bottleneck in the perfusion of neocortex. Proc Natl Acad Sci USA. 2007;104:365–370. - PMC - PubMed
    1. Blinder P, et al. The cortical angiome: an interconnected vascular network with noncolumnar patterns of blood flow. Nat Neurosci. 2013;16:889–897. - PMC - PubMed