

Slow progress in diarrhea case management in low and middle income countries: evidence from cross-sectional national surveys, 1985-2012
- PMID: 28320354
- PMCID: PMC5360044
- DOI: 10.1186/s12887-017-0836-6
Slow progress in diarrhea case management in low and middle income countries: evidence from cross-sectional national surveys, 1985-2012
Abstract
Background: Diarrhea remains to be a main cause of childhood mortality. Diarrhea case management indicators reflect the effectiveness of child survival interventions. We aimed to assess time trends and country-wise changes in diarrhea case management indicators among under-5 children in low-and-middle-income countries.
Methods: We analyzed aggregate data from Demographic and Health Surveys and Multiple Indicator Cluster Surveys done from 1986 to 2012 in low-and-middle-income countries. Two-week prevalence rates of diarrhea, caregiver's care seeking behavior and three case management indicators were analyzed. We assessed overall time trends across the countries using panel data analyses and country-level changes between two sequential surveys.
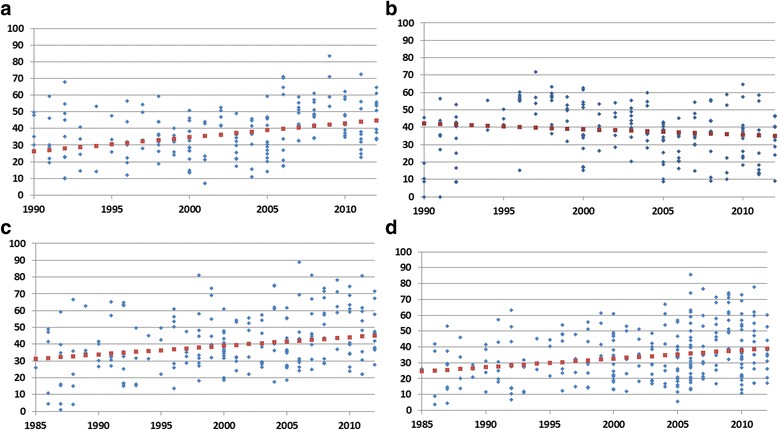
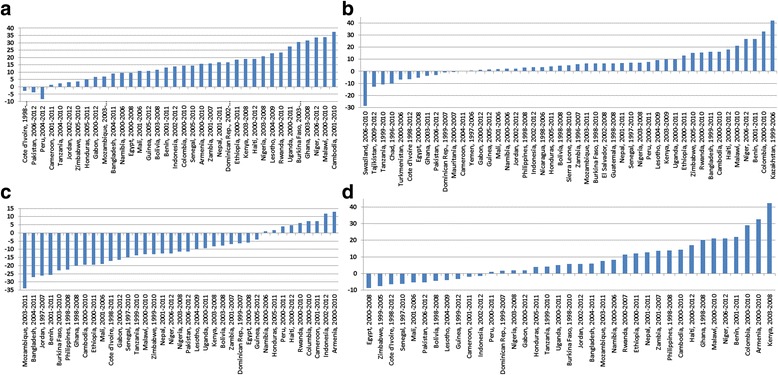
Results: Overall, yearly increase in case management indicators ranged from 1 · 3 to 2 · 5%. In the year 2012, <50% of the children were given correct treatment (received oral rehydration and increased fluids) for diarrhea. Annually, an estimated 300 to 350 million children were not given oral rehydration solutions, or recommended home fluids or 'increased fluids' and 304 million children not taken to a healthcare provider during an episode of diarrhea. Overall, care seeking for diarrhea, increased from pre-2000 to post-2000, i.e. from 35 to 45%; oral rehydration rates increased by about 7% but the rate of 'increased fluids' decreased by 14%. Country-level trends showed that care seeking had decreased in 15 countries but increased in 33 countries. Care seeking from a healthcare provider increased by ≥10% in about 23 countries. Oral rehydration rates had increased by ≥10% in 15 countries and in 30 countries oral rehydration rates increased by <10%.
Conclusions: Very limited progress has been made in the case management of childhood diarrhea. A better understanding of caregiver's care seeking behavior and health care provider's case management practices is needed to improve diarrhea case management in low- and-middle-income countries.
Keywords: Case management; Child health services; Developing countries; Diarrhea; Oral rehydration therapy; Trends; Under-5 child.
Figures
References
-
- Wang H, Liddell CA, Coates MM, Mooney MD, Levitz CE, Schumacher AE, et al. Global, regional, and national levels of neonatal, infant, and under-5 mortality during 1990-2013: a systematic analysis for the Global Burden of Disease Study 2013. Lancet. 2014;384:957–979. doi: 10.1016/S0140-6736(14)60497-9. - DOI - PMC - PubMed
-
- Fund UNC’s. Levels & Trends in Child Mortality, Estimates Developed by the UN Inter-agency Group for Child Mortality Estimation. New York: UNICEF; 2012.
-
- United Nations . Transforming our world: the 2030 Agenda for SustainableDevelopment. New York: United Nations; 2016.
MeSH terms
LinkOut - more resources
Full Text Sources
Other Literature Sources
Medical
