. 2017 May 25;129(21):2896-2907.
doi: 10.1182/blood-2016-09-742825. Epub 2017 Mar 20.

Plasmin and plasminogen induce macrophage reprogramming and regulate key steps of inflammation resolution via annexin A1

Affiliations

Plasmin and plasminogen induce macrophage reprogramming and regulate key steps of inflammation resolution via annexin A1

Michelle A Sugimoto et al. Blood. .

Erratum in

Abstract

Inflammation resolution is an active process that functions to restore tissue homeostasis. The participation of the plasminogen (Plg)/plasmin (Pla) system in the productive phase of inflammation is well known, but its involvement in the resolution phase remains unclear. Therefore, we aimed to investigate the potential role of Plg/Pla in key events during the resolution of acute inflammation and its underlying mechanisms. Plg/Pla injection into the pleural cavity of BALB/c mice induced a time-dependent influx of mononuclear cells that were primarily macrophages of anti-inflammatory (M2 [F4/80high Gr1- CD11bhigh]) and proresolving (Mres [F4/80med CD11blow]) phenotypes, without changing the number of macrophages with a proinflammatory profile (M1 [F4/80low Gr1+ CD11bmed]). Pleural injection of Plg/Pla also increased M2 markers (CD206 and arginase-1) and secretory products (transforming growth factor β and interleukin-6) and decreased the expression of inducible nitric oxide synthase (M1 marker). During the resolving phase of lipopolysaccharide (LPS)-induced inflammation when resolving macrophages predominate, we found increased Plg expression and Pla activity, further supporting a link between the Plg/Pla system and key cellular events in resolution. Indeed, Plg or Pla given at the peak of inflammation promoted resolution by decreasing neutrophil numbers and increasing neutrophil apoptosis and efferocytosis in a serine-protease inhibitor-sensitive manner. Next, we confirmed the ability of Plg/Pla to both promote efferocytosis and override the prosurvival effect of LPS via annexin A1. These findings suggest that Plg and Pla regulate several key steps in inflammation resolution, namely, neutrophil apoptosis, macrophage reprogramming, and efferocytosis, which have a major impact on the establishment of an efficient resolution process.


Figures

Figure 1.
Figure 1.
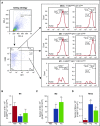
Profile of macrophages recruited to the pleural cavity after injection of Plg/Pla. BALB/c mice were challenged by an i.pl. injection of Plg (2 µg per cavity), Pla (2 µg per cavity), or PBS (vehicle). The cells obtained from the pleural lavage 48 hours after injection of Plg/Pla were analyzed by flow cytometry according to their size and granularity and expression of surface molecules F4/80, CD11b, and Gr1, as described in the gating strategy (A). The cells that migrated to the cavity were classified as M1 (F4/80low Gr1+ Cd11bmed) (B), M2 (F4/80high Gr1 CD11bhigh) (C), and Mres (F4/80med CD11blow) (D) subpopulations of macrophages. Results are expressed as the number of cells and as the mean ± SEM of at least 4 mice in each group. The experiment was performed 3 times with similar results. *P < .05; **P < .01 when compared with mice challenged with PBS.
Figure 2.
Figure 2.
Expression of genes involved in the genetic signatures of M1 and M2 macrophages and cytokine production after injection of Pla. BALB/c mice were challenged by i.pl. injection of Pla (2 µg per cavity) or PBS (vehicle). mRNA from the cells obtained from the pleural cavity 24 and 48 hours after Pla injection was analyzed by qRT-PCR for iNOS (A), CD206 (B), and Arg-1 (C). Supernatants of pleural exudates were obtained 6, 12, and 24 hours after Pla injection and analyzed by ELISA for TGF-β (D), IL-10 (E), and IL-6 (F). Data are shown as the mean ± SEM of at least 4 mice in each group. The significance of the ELISA results was determined by Student t test for comparisons between PBS and each time point posttreatment. Analyses of gene expression and cytokine production were performed with 2 replicates with samples of all groups run on 1 plate. Experiments were performed at least 3 times with similar results. *P < .05; ***P < .001 when compared with mice challenged with PBS.
Figure 3.
Figure 3.
Plg expression and Pla activity during a self-resolving model of inflammation. BALB/c mice were injected with LPS (250 ng per cavity, i.pl.) or PBS (i.pl.). Cells present in the pleural cavity were harvested at the indicated time points and processed for total cell counts in a Newbauer chamber and for differential leukocyte counts by light microscopy of cytospin preparations (A), western blot analysis for Plg (B), and measurement of Pla activity (C). The pleural cellularity was expressed as the number of leukocytes per cavity and is shown as the mean ± SEM of at least 4 mice in each group. *P < .05; ***P < .001 when compared with mice injected with PBS. #P < .05; ##P < .01; ###P < .001 when compared with mice injected with LPS for 8 hours. &&P < .01; &&&P < .01 when compared with mice challenged with LPS for 24 hours. Blots are representative of 3 independent experiments using pooled cells from at least 5 animals. For loading control, membranes were reprobed with anti–β-actin. For the Pla activity assay, results are expressed as plasmin activity unities mean ± SEM of at least 5 mice. ***P < .001 when compared with the untreated group.
Figure 4.
Figure 4.
Effect of Plg/Pla treatment in an LPS-induced pleurisy model. Mice received an i.pl. injection of LPS (250 ng per cavity) or PBS. After 8 hours of challenge, mice were treated with Plg (2 µg per cavity, i.pl.) or Pla (2 µg per cavity, i.pl.). PBS (vehicle, i.pl.) was injected in both unchallenged control mice and LPS-challenged mice. Ten hours later, the pleural cells were harvested, and cytospin preparations were analyzed for the number of neutrophils per cavity (A) as well as the percentage of apoptosis (B) and efferocytosis (C). In the same experimental settings, Plg (2 µg) was incubated with the serine protease inhibitor aprotinin (17.5 µg) for 1 hour at 37°C prior to i.pl. injection (D,E). Results are expressed as the mean ± SEM of at least 4 mice in each group. **P < .01; ***P < .001 when compared with unchallenged mice; ###P < .001 when compared with untreated mice. (F) Neutrophils isolated from peripheral blood of healthy human donors were cultured in 96-well cell culture plates (106 cells per well) with or without LPS (500 ng/mL) for 1 hour, and thereafter with or without Plg/Pla (2 µg/mL) for an additional 5 hours. Then, cytospin preparations were stained with May-Grünwald-Giemsa and counted for apoptosis (F). Representative figures are shown in (G). Arrows indicate apoptotic neutrophils. Scale bars, 10 µm. Original magnification ×20. **P < .01 when comparing LPS-treated group with untreated (UT) neutrophils; #P < .05 when comparing LPS-treated cells alone and LPS-treated cells after incubation with Plg or Pla. In vitro experiments were performed twice with different donors in biological triplicates.
Figure 5.
Figure 5.
Effect of Plg/Pla on in vivo peritoneal macrophage efferocytic capacity. Mice received an i.p. injection of 0.1 mg of zymosan and then were injected i.p. with Plg (2 µg per cavity), Pla (2 µg per cavity), or vehicle 62 hours later. Seven hours after treatments, mice were injected i.p. with 106 apoptotic neutrophils. Mice were killed 3 hours later. (A) Efferocytosis was assessed on cytospin preparations of cells harvested from peritoneal lavage after staining with May-Grünwald-Giemsa. Representative figures are shown in (B). Original magnification ×40. In the same experimental settings, 2 µg of Pla was incubated with 11.2 µg of VPLCK or 3.5 mg of EACA for 1 hour at 37°C prior to i.p. injection (C). Results are presented as the mean efferocytosis index ± SEM. The experiments were performed 3 times with at least 5 mice in each group. *P < .05; **P < .01 when compared with untreated mice; #P < .05 when compared with Pla-treated mice.
Figure 6.
Figure 6.
Involvement of AnxA1 in Plg/Pla-induced apoptosis and efferocytosis. BALB/c mice were challenged with an i.pl. injection of Pla (2 µg per cavity) or PBS (vehicle). The cells that migrated to the pleural cavity were collected 3, 6, 24, and 48 hours after challenge and analyzed for AnxA1 mRNA expression by qRT-PCR (A), protein expression by western blot (B), and cell surface externalization by flow cytometry (C-F). Pleural cells obtained 48 hours after injection of Plg/Pla were surface stained and gated on F4/80-positive cells, and then analyzed for AnxA1. Data report the percentage (C) and the absolute number (D) of cells positive for AnxA1. Pleural cells were gated as in Figure 1, and then M2 (E) and Mres (F) subpopulations of macrophages were analyzed for AnxA1. Data are mean ± SEM. *P < .05; **P < .01; ***P < .001 when compared with mice injected with PBS. Neutrophils isolated from peripheral blood of healthy human donors were cultured in 96-well cell culture plates (106 cells per well) with or without anti-AnxA1 antiserum (8 µg of hyperimmune serum per well) for 1 hour, and then treated with LPS (500 ng/ml) or LPS plus Plg (2 µg/ml) for an additional 5 hours. Cytospin slides of neutrophils were counted for apoptosis. **P < .01 when compared with untreated (UT) neutrophils; ##P < .01 when compared with the LPS-treated group. The experiments were performed twice with different donors in biological triplicates (G). WT and AnxA1 KO mice received an i.p. injection of zymosan, and were injected i.p. 62 hours later with Plg (2 µg per cavity) or vehicle. Seven hours after treatment, mice were injected i.p. with 106 apoptotic neutrophils. Mice were killed 3 hours after injecting prey neutrophils (see the schematic representation of experimental protocol in Figure 5). Efferocytosis was assessed on cytospin preparations of cells harvested from peritoneal lavage. Results are presented as the mean efferocytosis index ± SEM of 5 mice. **P < .01 comparing Plg-treated WT mice vs Plg-treated Anx1 KO mice (H). qRT-PCR results are presented as the fold increase of mRNA expression relative to the amount present in control samples. Analyses of gene expression were performed with 2 replicates with samples of all groups run on 1 plate. Blots were normalized with β-actin and are representative of 3 independent experiments using pooled cells from at least 5 animals. All experiments were performed at least 3 times with similar results.
Figure 7.
Figure 7.
Schematic representation of the proposed role of the Plg/Pla system in the resolution of inflammation. The results of previous studies and of the current study indicate that the Plg/Pla system contributes to the termination of the inflammatory process by regulating distinct steps of resolution.,,,,-,, It has been previously shown that Pla induces monocyte recruitment from the bloodstream to inflammatory sites,,,, a critical step in acute inflammation that enables further clearance of apoptotic neutrophils and orderly progression toward resolution (1). Our current data also suggest that Plg and Pla induce polarization of macrophages to M2, which are highly efferocytic, and Mres subtypes, which are known to express high levels of anti-inflammatory, antifibrotic, and antioxidant mediators (2)., Furthermore, we demonstrate that the Plg/Pla system promotes neutrophil apoptosis in the inflammatory milieu (3) and enhances the efferocytosis capacity of macrophages (4). The underlying mechanism is associated with increased AnxA1 expression and activity because the absence of AnxA1 prevents neutrophil apoptosis and efferocytosis promoted by Plg. This is supported by reports indicating that AnxA1 acts as a bridging molecule between phosphatidylserine (PS) on the dying cell and the phagocyte favoring efferocytosis.,, Together, these steps may contribute to the reduced accumulation of neutrophils in the inflammatory site promoted by Plg/Pla in the pleurisy model. The proresolving effects summarized in this figure (1-4) were described for both active Pla and its zymogen, Plg. Arrows linking Plg to Pla indicate a requirement of Pla protease activity for the proresolving effect of Plg. Our findings and those of others suggest that the effects of Plg on resolution require its conversion to active Pla, as demonstrated for Plg-induced monocyte recruitment,, efferocytosis,- and Arg-1 stimulation on macrophages.

Comment in

References

    1. Sousa LP, Alessandri AL, Pinho V, Teixeira MM. Pharmacological strategies to resolve acute inflammation. Curr Opin Pharmacol. 2013;13(4):625-631. - PubMed
    1. Nathan C, Ding A. Nonresolving inflammation. Cell. 2010;140(6):871-882. - PubMed
    1. Alessandri AL, Sousa LP, Lucas CD, Rossi AG, Pinho V, Teixeira MM. Resolution of inflammation: mechanisms and opportunity for drug development. Pharmacol Ther. 2013;139(2):189-212. - PubMed
    1. Sugimoto MA, Sousa LP, Pinho V, Perretti M, Teixeira MM. Resolution of inflammation: what controls its onset? Front Immunol. 2016;7:160. - PMC - PubMed
    1. Poon IK, Lucas CD, Rossi AG, Ravichandran KS. Apoptotic cell clearance: basic biology and therapeutic potential. Nat Rev Immunol. 2014;14(3):166-180. - PMC - PubMed

Publication types

MeSH terms